Schoeller-Bleckmann Oilfield Equipment AGAG stock analysis – Overlooked Cash flow machine?
Schoeller-Bleckmann Oilfield Equipment AG stock analysis is part of my full, stock by stock analysis of the Austrian Stock Market that offers interesting investing opportunities. Check my Austrian Stocks List for more Austrian stocks.
Schoeller-Bleckmann Oilfield Equipment AG (SBO) is a leading oilfield equipment supplier for the oilfield service industry. Currently, the company offers a 15 % cash flow yield.
Sounds impressive, right? Is there no negative? This analysis will answer these two questions. We look at the stock price, the business fundamentals, do a cash flow based valuation, and come to a conclusion.
Schoeller-Bleckmann Oilfield Equipment stock price analysis – VIE:SBO
Schoeller-Bleckmann stock price is very volatile. It reached a high before the financial crisis in 2008 of 75 EUR and afterward dropped to 19 EUR. The second runup was up up to 2015 (96 EUR). The stock reached an all-time high in 2018 with 109 EUR. It consequently declined to the current stock price level of 27.3 EUR.
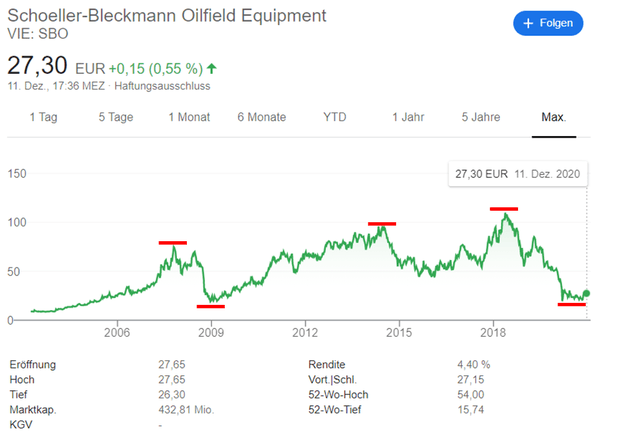
The stock is down 75 % since 2018. More interestingly is how the stock price is closely correlated to the oil price.
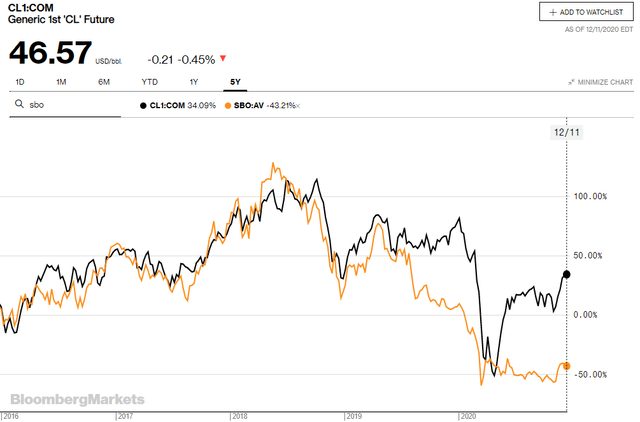
Oil and SBO stock moved in tandem over the last five years exept since the COVID-19 crisis in March 2020. The oil price (black line) rebounded, and the stock stayed flat. SOB is a clear cyclical stock in the Peter Lynch stock categories, as we will also see in the cash flow discussion, it all depends on oil prices.
About two-thirds of the shares are in trading free float. Berndorf Industrieholding AG holds the rest and is the core shareholder. It is a holding company with over 60 companies in 20 countries focusing on globally active, medium-sized industrial companies in niche markets.
Schoeller-Bleckmann Oilfield Equipment Business fundamentals
The focus is on manufacturing high-precision components made from non-magnetic, high-alloy stainless steels for drill string components. The other part is high-tech downhole tools for drilling and completing directional and horizontal wells. SBO produces precisely according to the requirements of the customers.
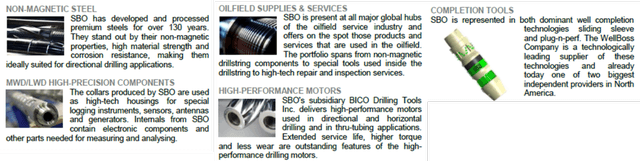
What is directional drilling, you may ask? It is a technology for precisely targeting oil and gas reservoirs that are not directly located below the drilling rig. It can be used as a continuous control, monitoring, and adjusting the drilling process. The technology is considered an essential resource for exploiting future reservoirs and ensuring higher recovery rates and overall well productivity. The primary market for SB is the oil and gas industry. Since 2016 the company can produce parts for the aerospace sector as a particular certification is needed, but this business is tiny.
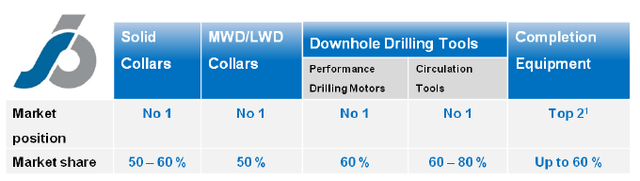
Special logging instruments (MWD = Measurement while drilling and LWD = Logging while drilling), sensors, antennas, and generators need housing, and SBO produces collars for that. SBO has enormous market shares of over 50 % in each of its markets and is a hidden champion.
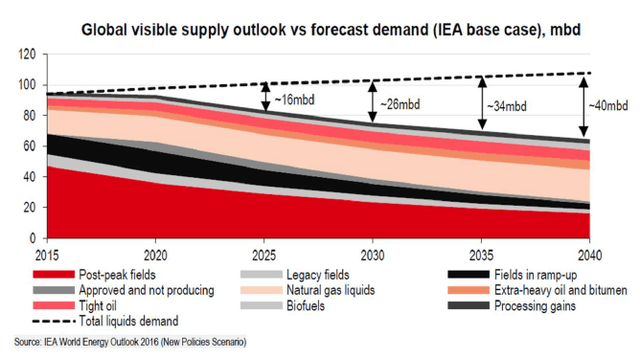
Future growth possibilities come from rising demand for gas. The rationale behind sre the lower carbon emissions from gas produced electricity. Electricity demand is rising (E-mobility, growth in cities, etc.), but at the same time, environmental standards are rising. When generating electricity, coal produces 50 % higher carbon emissions than oil and 75 % higher carbon emissions than gas. The switch to renewable sources would not be enough to achieve the Paris Climate Agreement’s environmental goals. Therefore, coal needs to be substituted by gas. The International Energy Agency (IEA) projects a marked rise in global demand for oil by 0.5 % per year to 104.9 mb/d until 2040. Demand for crude oil and natural gas is also expected to increase in absolute figures, by +9% (crude oil) and +36% (natural gas) by 2040.
SOB can profit from the above mentioned increase of demand, especially as easily accessible oil and gas fields have already been discovered. The new oil and gas reservoirs require complex technologies as well have declining production rates.
You have to be cautious with forecasts, especially with the extreme ones. That oil will no longer be available has been said since the 1980s, on the other hand, a significant growth in demand for oil is also not very likely. I have analyzed oil and its outlook here;, and in the short and medium-term, there will not be a significant structural shift but the small changes in demand will keep the whole sector cyclical.
For SOB, the rig count is critical, and these declined below their crisis levels in 2016 (see below).
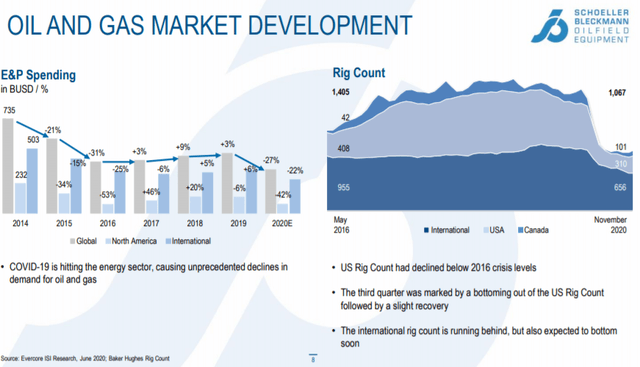
The E&P spending declined in 2020 after staying flat for 5 years. On the positive side, the critical number of rigs already had a slight recovery in the US.
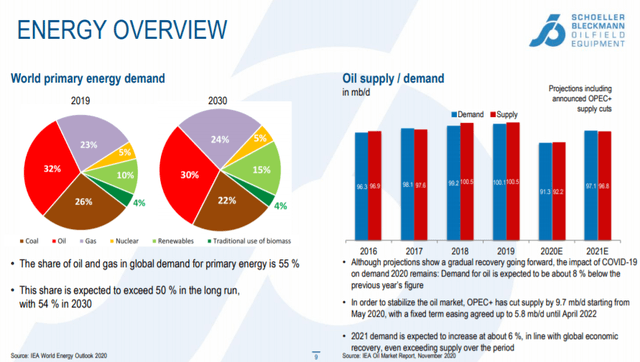
In the long-term, the share of oil and gas demand should stay above 50 % up until 2030. Oil is declining, but gas is rising.
Schoeller-Bleckmann Oilfield Equipment stock fundamentals
The balance sheet as of Q3 2020 is in a strong position. SBO has 322 million EUR in cash, long-term loans of 249 million EUR, and 62 million EUR in short-term liabilities.
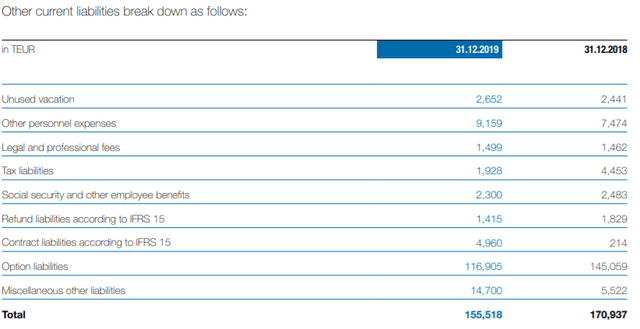
Other liabilities amount to about 159 million EUR and are mainly due to option liabilities, which we should keep in mind.
Besides the strong balance sheet, SOB has good operating cash flows.
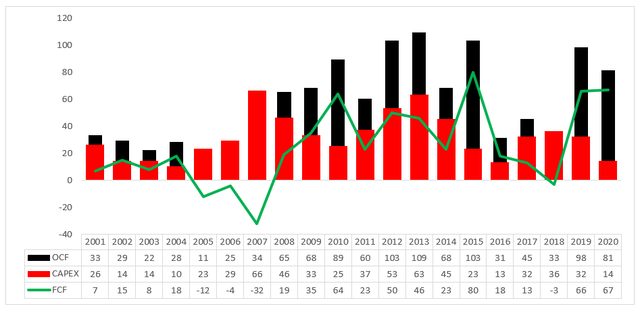
The free cash flow was negative from 2005 till 2007 and again in 2018. On average, over the past twenty years operating cash flow was 57 million EUR, 32 million EUR in CAPEX, and 25 million EUR in free cash flow, equaling a free cash flow yield of around 6 %. In good years, the yield climbs to 15 %, and in bad years it is negative – a typical cyclical stock.
Schoeller-Bleckmann Oilfield Equipment dividend
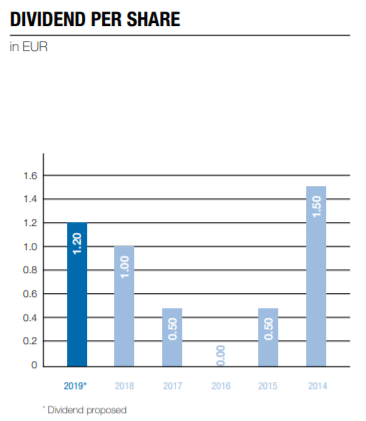
Currently (Q3 2020), the company has a free cash flow of about 67 million EUR. Being conservative, I do not add more cashflow for 2020. The dividend payout is about 18 million EUR. There is a lot of room to grow the dividend, but the management has not made a clear statement of how much will they payout. Schoeller-Bleckmann’s management are saying that in every successful year, the shareholders will participate in the results achieved. A plus as the company is not focusing on just paying out a dividend to keep shareholders happy and, therefore, focus more on its financial fundamentals.
On the other hand, the company got new financial liabilities of 24 million EUR. The only reasoning behind that is the low-interest rates and the manageable debt of 2 times free cash flow (67 million EUR to 311 million EUR).
Like with every cyclical company, it is possible to say if the dividend will be safe in the future. It all depends on the underlying business’s performance and SBO, mainly on oil and gas demand.
Schoeller-Bleckmann stock valuation
The valuation is based on the free cash flow with a terminal value of 10 and a discount rate of 15 % for the expected return. The three scenarios are:
- Worst case: no growth in the next 5 years and a 2 % decline afterward (25% probability)
- Best case: 5 % growth in the next 5 years and 2 % afterward (25% probability)
- Normal case: 2 % in the next 5 years and then no growth (50 % probability)
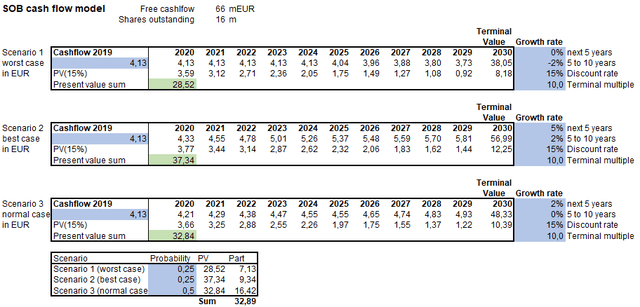
If we take the current cash flow of 66 million EUR, the SBO stock’s fair value would be around 33 EUR and is undervalued by 20 %. But it is not ideal to take the cash flow of a good year. It is more accurate to use the average of the past 10 years as it also includes cash flows of the downturn years. This shows an entirely different picture:
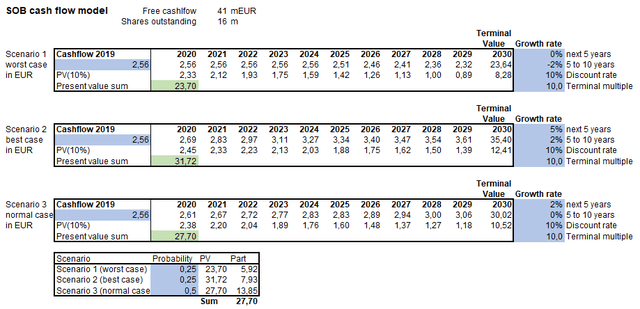
The stock is currently fairly valued; however, not with an expected return of 15 %. It is fair valued when we assume a discount rate of 10 %.
The management is sensing an undervaluation of its stock as they launched a buyback program on 23 March 2020. About 1.45% of the outstanding shares were repurchased.
SBO stock investment outlook
The negative about SBO is the cyclicality and the dependency on oil demand. The positives are many. With over 320 million in cash, the company has substantial liquidity. It has a high free cash flow yield. The stock moved in tandem with the oil price over the past five years but did not rebound as the oil price. If you expect a 10 % business return and take the safer average cash flow into account, the stock is fairly valued now. But keep in mind the characteristics of these cycles: they flourish when the economy turns good again and suffer with no growth. 50 % drops are normal.
You have to see how it fits your portfolio and investment style.