Wienerberger AG AG stock analysis – Too Much Europe Risk For Me
Wienerberger AG stock analysis is part of my full, stock by stock analysis of the Austrian Stock Market that offers interesting investing opportunities. Check my Austrian Stocks List for more Austrian stocks.
Wienerberger AG stock price analysis – VIE:WIE
Wienerberger had a significant stock price increase up to the financial crisis in 2008. Since then, the stock price did not reach the all-time high of above 50 EUR again. But from 2012 onwards, the stock has had a steady run-up from 5 EUR to 27 EUR, with just a few small ups and downs.
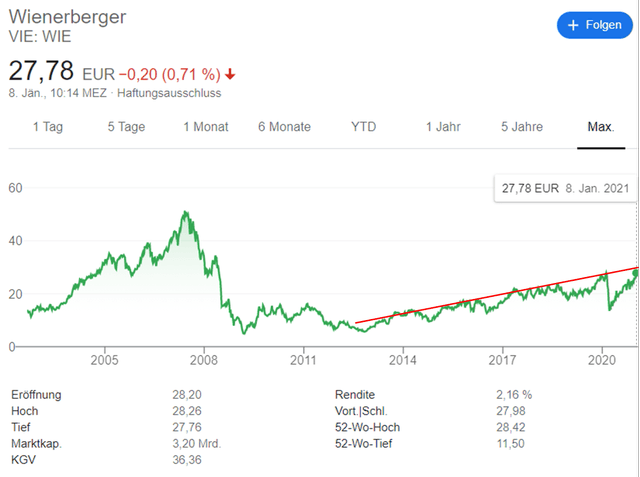
Looking at the stock chart, it is not possible to derive in which Peter Lynch stock category would Wienerberger fall but, as Wienerberger is producing bricks for the construction industry, the company is surely affected by business cycles. Let us look at the business model, the fundamentals, and give an investment outlook.
Wienerberger AG stock analysis – Business fundamentals
Wienerberger manufactures building materials and creates infrastructure solutions. Its product portfolio includes bricks for walls, facades, and roofs. Their bricks are used to build family homes, apartment buildings as well as commercial and public buildings. Additionally, pipe systems made from plastic and ceramic are in its product portfolio too.
These products are also used in residential buildings and are used to supply energy and drinking water or transmit data. Other products are concrete and clay pavements used in pedestrian zones in towns, public squares at train stations and airports, or private gardens.
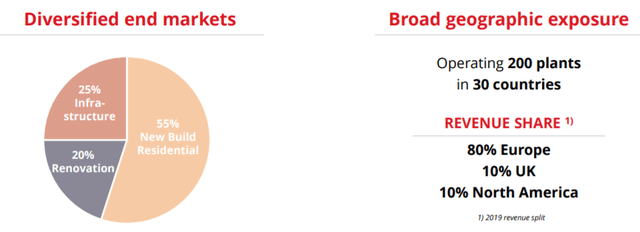
Its products are used 55 % in new residential buildings. A quarter is used in infrastructure (mainly their pipes), and 20 % is used in the renovation. The majority of revenue (80%) is generated in Europe, 10 % in the UK and 10 % in North America.
One focus for Wienerberger is to increase their exposure to North America. In December 2020, the acquisition of Meridian Brick led to Wienerberger becoming the leading supplier of masonry solutions in North America.
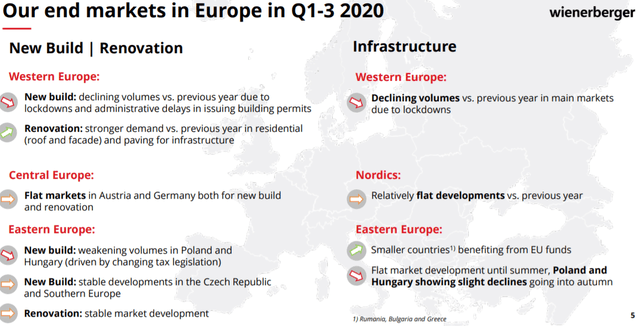
The short-term market outlook for Wienerbergers’ main market (Europe) is not that great. Most of the countries have flat or declining volumes. But that is just for the short-term. In the long-run, these markets will very likely recover given the need for new construction in Europe as the real estate market focuses on big cities and urban agglomerations. But, negative demographic trends might put pressure on sales. The key is how big of a moat the company has and how is the competition doing.
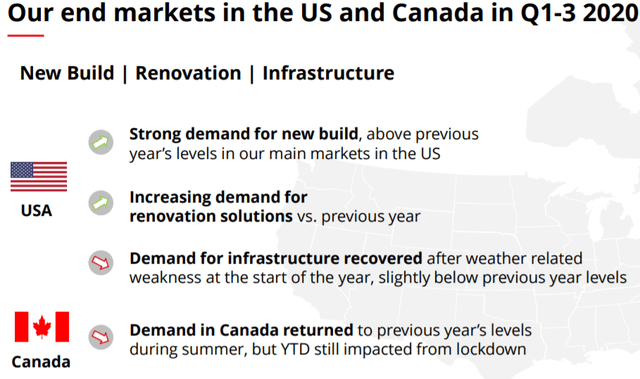
On the other hand, North America is showing a more robust demand for the products of Wienerberger. The company took advantage of it and has good exposure to this end market with Meridian Brick’s acquisition.
Wienerberger has a strong focus on shareholder value. Unlike many other family owned Austrian companies, Wienerberger has a free float of 100%. Institutional investors hold the majority of shares, and private investors own only 15 %.
Its strategy is to grow organic in its core competencies and use innovative solutions in these. Another strategy is to improve operational excellence, improving their efficiency and profitability, and cost-cutting. Further growth should come from small to mid-sized acquisitions.
Wienerberger Dividend
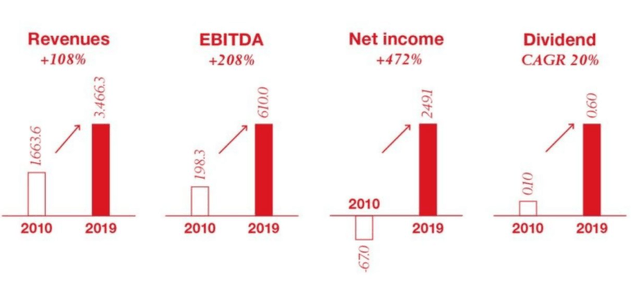
Since their turnaround beginning in 2010, Wienerberger paid out a dividend, which increased 500% in the last ten years. But it is to mention that the dividend was very small in the beginning.

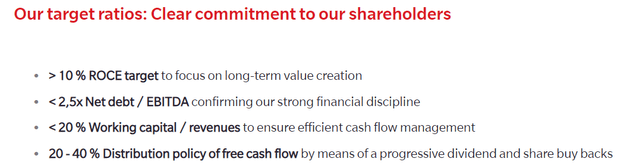
Wienerberger has a dividend policy of distributing 20 % to 40 % of its free cash flow to the shareholder with a progressive dividend and additional share buybacks.
Wienerberger AG stock analysis – Financial discussion
On the positive, the Wienerberger stock was able to nearly double its revenue in the last ten years.
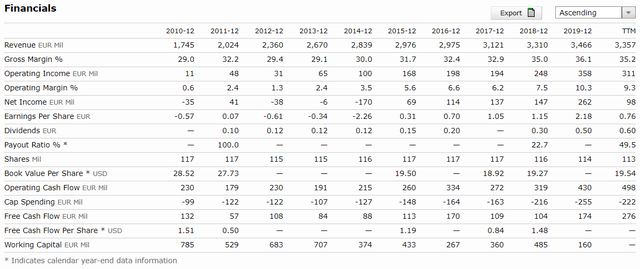
The other side is the net income, which was very volatile. It was negative with 170 million EUR in some years, but lately, it was stable in the positive. Additionally, the free cash flow was positive in all of the years. The operating cash flow doubled as well.
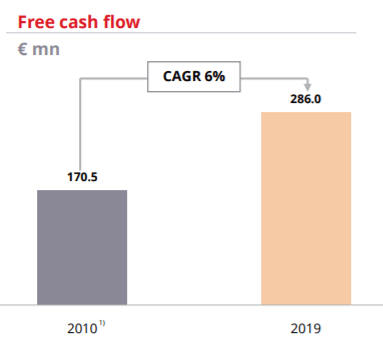
In the last ten years, Wienerberger increased the free cash flow by 6 % p.a. Even during the Covid-19 crisis, the company was able to generate a positive free cash flow. In the first three quarters of 2020, it generated about 168 million EUR.
As already mentioned, Wienerberger has communicated its commitment to its shareholder. The goal is to create a return on capital employed (ROCE) of over 10 % for the long term and keep the debt at reasonable levels.
If we take the free cash flow for the first three quarters and extrapolate it for the fourth quarter, we get 224 million EUR. In the best case, 40 % are used for the dividend, potentially paying out 90 million EUR or equal to a dividend yield of 2.6 %. For a year with immense struggles in the construction business, a good value.
The company currently has about 1.4 billion EUR in long-term debt and 200 million EUR in short-term financial liabilities, and 400 million in other current liabilities. But Wienerberger has a lot of money on its balance sheet – to be precise, the company has 1.9 billion EUR in cash. Therefore, the net debt is nearly zero, which is a major positive factor.
The dividend growth is high, but it started nearly at zero. Therefore, it is easier to show a reasonable growth rate, and the growth of the free cash flow will be used in the model.
Wienerberger stock valuation
A cash flow model will give a rough stock price valuation. This model’s general assumptions are a discount rate of 5% and a terminal multiple depending on the growth. The model uses the dividend as the goal is to discount free cash flow, which is available to shareholders.
In the model below are three scenarios:
- Scenario 1 (normal case): 6 % growth for 10 years (similar growth happened in the past) with a 60 % probability
- Scenario 2 (best case): 12 % growth (double) for 10 years with a 20 % probability
- Scenario 3 (worst case): 2% growth (just inflation) for 10 years with 20 % probability
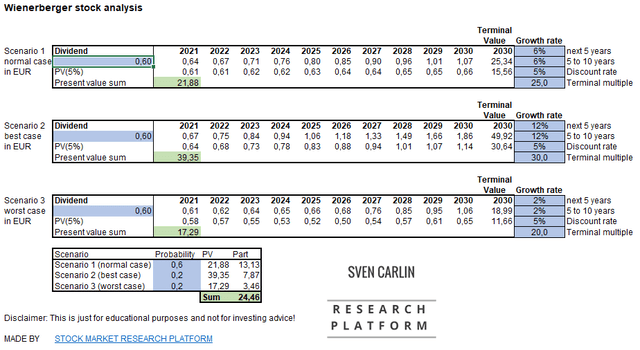
Wienerberger AG stock valuation – Source: own graphic (downloadable template)
Based on this model, the investor could expect a return of 5 % annually with the current stock price and the assumption form above, which is in line with the free cash flow growth over the last years.
Wienerberger AG stock analysis – Conclusion and investment outlook
Wienerberger has a solid business model, a healthy balance sheet with nearly zero debt, and strong free cash flows. As the company has a lot of positive aspects, the company has a very high valuation already. The expected return is around 5 %. Still better than leaving the money in the bank with 0.1 % interest rates but there is better out there.
Wienerberger might be a good cyclical play to follow to play on the inevitable economic cycles to be hitting Europe in the future. Given the money printed and worsening demographics on higher and higher deficits, I think things in Europe will be volatile, so will be Wienerberger stock.
Better stocks can be found in Emerging markets, niches in Europe or in the commodity sectors.