The Paradox of All-Time Highs: Analyzing the Potential for a Market Bubble
In the current financial landscape, the stock market has reached all-time highs, prompting a critical question: is this the greatest bubble of all time? As an investor with a quarter-century of experience in value investing, I have analyzed the underlying mechanics driving this surge and the potential risks that lie ahead.
The Inelastic Market Hypothesis
My analysis centers on the “Inelastic Market Hypothesis.” If you inject $1 into the current market, the resulting capitalization often increases by $5 to $8. This is driven by massive, unrelenting inflows: corporate buybacks (estimated at $1 trillion annually), aggressive ETF purchases, and persistent foreign inflows.
If you want to know more about the Inelastic Market Hypothesis, you can watch the video discussing it here:
Because investors are increasingly reluctant to sell—viewing the market as the only viable path to growth—liquidity is insufficient to satisfy the sheer volume of net positive inflows. This creates a self-reinforcing cycle. When market participants know that systematic forces will continue to push prices higher, the last thing they want to do is liquidate their positions, further tightening the “inelastic” nature of the market. Consequently, we see the S&P 500 trending toward levels like 8,000 points not necessarily through organic business expansion, but through the overwhelming weight of capital chasing limited supply.
Key Market Risks
Despite the momentum, the structural foundation of this market is becoming increasingly fragile:
- The Debt-Inflation Loop: The U.S. national debt is nearing $40 trillion, with net interest payments now exceeding $1 trillion. As interest rates remain elevated—with the 10-year Treasury hovering near 4.5%—the fiscal burden on the government is skyrocketing. Because the government cannot realistically pay back this debt, the only logical conclusion is that we are locked into a cycle of structural inflation. This creates a “negative risk premium” where stocks are bought not for their intrinsic yield—which is often lower than bond yields—but as a perceived hedge against the erosion of currency value.

- The Illusion of Profitability: Wall Street projections frequently present a bullish, exuberant picture of future earnings, forecasting figures like $250 per share for the S&P 500. However, “Wall Street reality” is consistently 10% to 15% lower than reported earnings once you adjust for non-recurring costs and stock-based compensation. Furthermore, companies are increasingly utilizing accounting maneuvers, such as extending the useful life of assets (e.g., Intel), to artificially bolster earnings by reducing depreciation expenses.
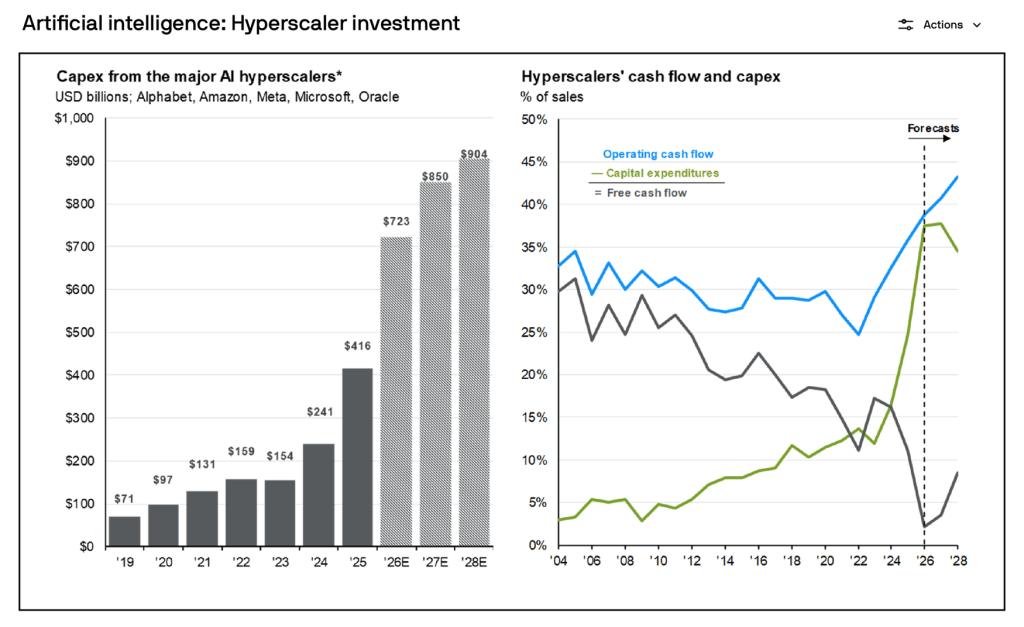
- The AI Capex Dilemma: Hyperscalers are currently engaged in a massive capital expenditure (capex) race, shifting from high-margin, free-cash-flow-positive models to asset-heavy infrastructure plays. As AI commoditization accelerates, the risk is that these companies will face declining profit margins. The demand for AI is currently high, in part because much of the utility is free; once these services move toward actual pricing models, it remains to be seen if the revenue will support the massive upfront investment.
- Approaching the Liquidity Crossover: We are tracking a critical date, approximately around 2028, when mandatory withdrawals (Required Minimum Distributions) from 401ks are expected to surpass the positive impact of new inflows. At this point, the natural buying pressure that has sustained this bull market will transition into a source of mandatory selling, potentially removing one of the primary pillars currently supporting the index.
The Path to a Reversion
“How did you go bankrupt?” a character in a Hemingway novel asks. “Two ways: gradually, then suddenly.” A market crash of 50% to 80%—potentially reverting the CAPE ratio back to historical averages near 15—would require a systemic breakdown of these forces. It requires the “emperor is naked” moment where investors finally panic.

If a recession hits, we could see a dramatic profit margin compression, similar to the 50% decline seen in 2008. In such a scenario, the S&P 500 could theoretically retest levels as low as 3,000 points. While this sounds impossible today, it is worth remembering that the market was at 3,500 just four years ago.

A Value Investing Perspective
For those focused on long-term wealth preservation, my strategy remains rooted in the following:
- Hedge with Intention: I utilize a “value-on-value” approach, focusing on good companies with growth potential that are insulated from market-wide volatility. My portfolios are hedged with options, which function as insurance; while I accept that these hedges may lose money if the market continues to climb, they are a vital safeguard against a potential 50% to 80% correction.
- Avoid the “Blow-off” Trap: Do not feel pressured to chase every rally. If you cannot find genuine value—as even Warren Buffett’s massive cash position suggests is currently difficult—there is no shame in patience.
- Focus on Owner’s Earnings: Ultimately, the only money that truly matters is that which can eventually be returned to shareholders as dividends or reliable cash flow. Asset inflation driven by speculation is temporary; ownership of businesses with sustainable pricing power and solid cash generation is what allows for true compounding over decades.
In closing, the goal of a rational investor is to ensure that you survive the cycle to keep playing the game. By acknowledging the risks of this inelastic, debt-fueled market and maintaining a margin of safety, you position yourself to thrive when the environment eventually turns.
For more in-depth analysis on this topic, watch the full discussion here: