Fresenius Stock Analysis – Solid Healthcare Investment
Fresenius Stock Analysis – Summary
Fresenius is an interesting play as the cash flow yield is in the teens, but there are also risks in the form of the business model that seems has to always expand, the debt and the low dividend payout due to the growth model feed needs. Also, cash flows are consolidated in the parent and thus lower in reality.
The Fresenius Group is more leveraged and diversified while Fresenius Medical Care is less leveraged and more focused. That is also reflected in the stock price.
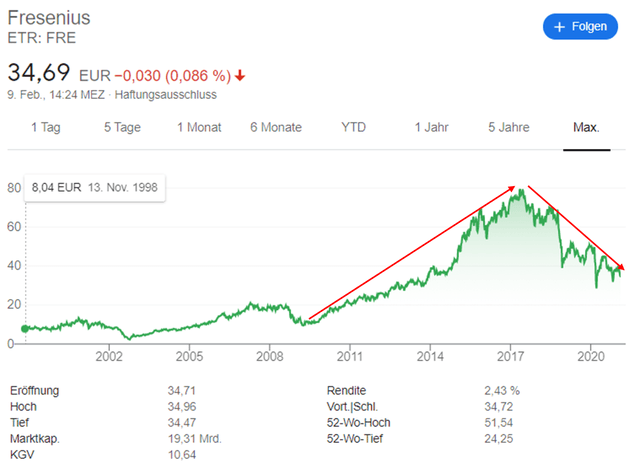
Fresenius stock price analysis – ETR:FRE
Fresenius went from being a solid compounder over the years to a miserable investment since the all-time high in 2017. The stock still trades 55% below the peak in a time-period where nearly every other stock went up.
In this analysis, we are going to look into the issues behind the weak stock performance. Fresenius operates in the health care industry and, therefore, not a very cyclical industry. The Peter Lynch stock category would be most likely a stalwart, but Fresenius seems to be a slow grower. Let us look at the business model, the fundamentals and give an outlook.
Fresenius stock analysis – Business fundamentals
Fresenius is a leading global provider of health care products and services.
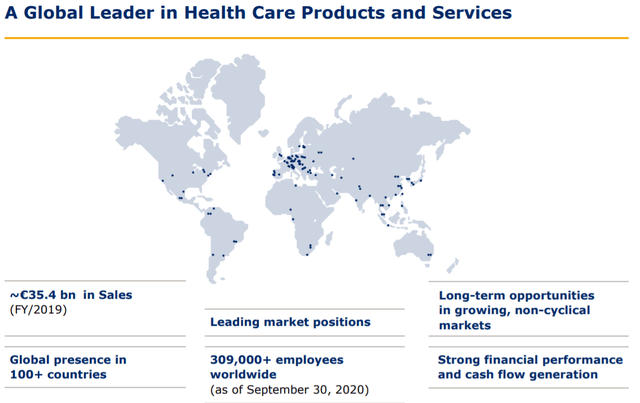
The company employs over 309,000 people worldwide and generates about 35 billion EUR in revenue. The business has four main segments, which all operate as separate subsidiaries.
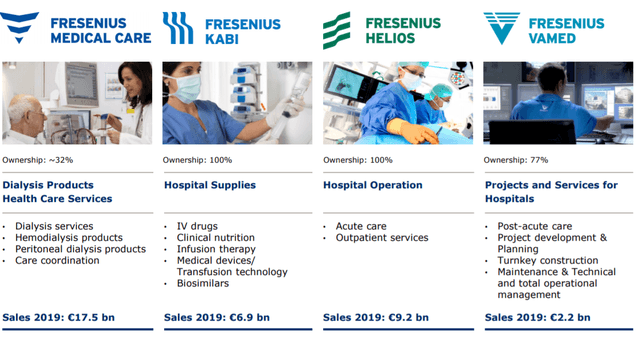
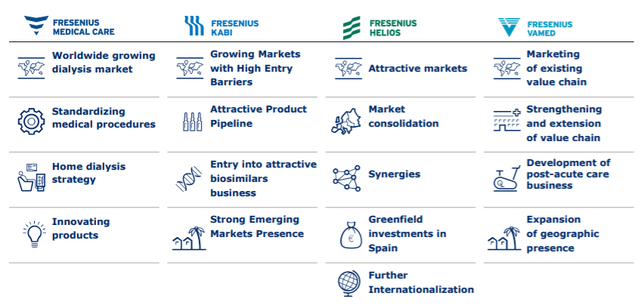
The first business segment is Fresenius Medical Care (FMC) and is also traded the stock exchange separately (NYSE: FMS). The company offers mainly dialysis services and more specialized services like hemodialysis products and peritoneal dialysis products. With about 50% of the total revenue, it is the largest business segment.
Fresenius holds 32 % of FMC, which has a market capitalization of 17.6 billion EUR. The 32% stake is therefore worth about 5.6 billion EUR.
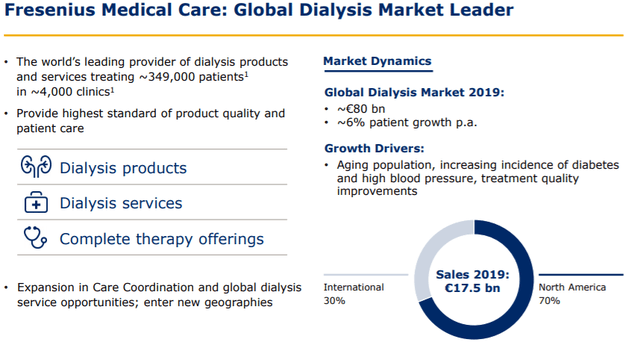
Fresenius Medical Care treats 349,000 patients and 4,000 clients. The dialysis market grew about 6% annually, whereas the main drivers are the aging population and increased diabetes and high blood pressure in the population. The business is most active in North America (70%), and only 30% of the revenue is generated in other countries.
The second segment is Fresenius Kabi, with the product portfolio of hospital supplies such as IV drugs, clinical nutrition, infusion therapy, medical devices, and biosimilars. These products are essential for critically and chronically ill patients. The segment generates about 20% of the revenue.
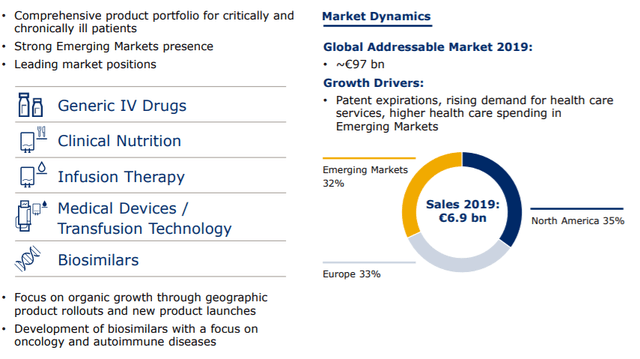
Fresenius Kabi has a leading market position and a strong presence in the emerging markets (32%). The other two-thirds of the business is done with Europe and North America. The growth is generated organically through geographic product rollouts and new product launches. Expiring patents for their generic IV drugs, the rising demand for general health care services, and increased health care spending in emerging markets fuel the growth.
The third segment is Fresenius Helios. This subsidiary operates private hospitals and performs acute care and outpatient services. Fresenius Helios makes 26% of the revenue. The main market for Fresenius Helios is Germany (86 hospitals and 125 outpatient treatment centers) but also has hospitals in Spain and Latin America.
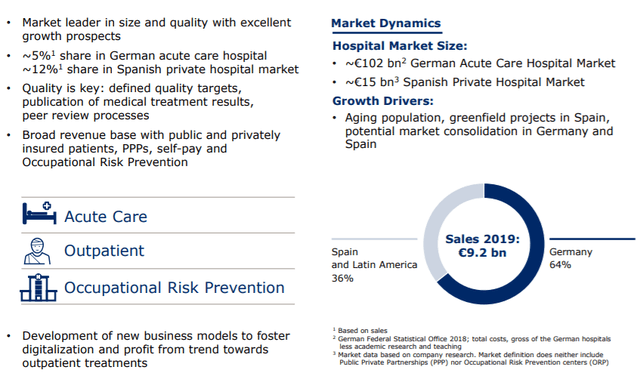
Fresenius Helios is Europe’s largest private hospital operator, whereas the segment holds a 5% market share in Germany and 12% in Spain with its private hospitals. The growth drivers are here again the aging population, new projects in Spain, and potential market consolidation in both core markets.
Fresenius Kabi and Fresenius Helios are a 100% subsidiary of Fresenius.
The last segment is the smallest as it just generates 6% of the revenue. The Fresenius Vamed operates special projects and services for health care facilities. The projects and services cover the entire process of planning, construction, and operation of a new health care facility.
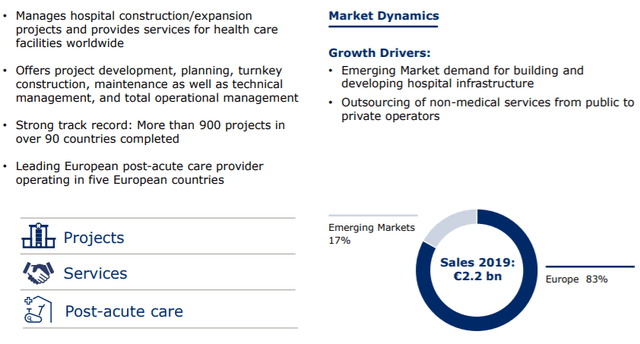
The company has already completed more than 900 projects in 90 countries. The growth drivers in this segment are the emerging market demand for the building and developing of hospital infrastructure. Currently, 83% of the revenue is generated in Europe and 17 % in the emerging markets. Fresenius owns 77% of Fresenius Vamed.
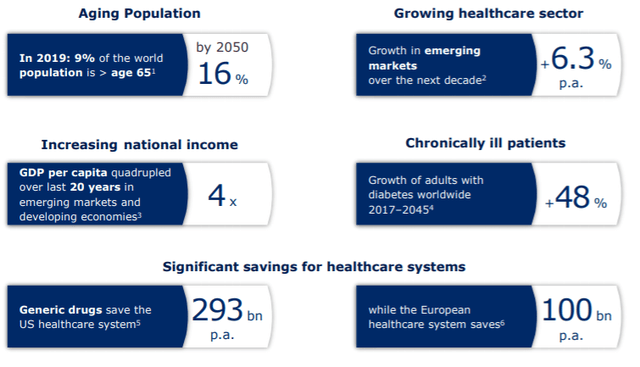
As already mentioned in the segment description, Fresenius can benefit from different growth drivers. The main driver for the whole company is the aging population. In 2019, 9% of the world population was over 65 years. In 2050, the number should increase to 16% as life expectancy increases.
The increase of GDP per capita spending on healthcare is also beneficial for Fresenius. Sadly, the number of chronically ill patients is also growing. In 2045 around 48% of adults will have diabetes worldwide.
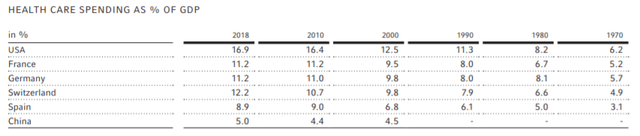
Another growth prospect for Fresenius is the growing health care sector, especially the emerging market growth of 6 % annually. The USA has nearly tripled their health care spending over the last 50 years.
The last growth aspect of Fresenius is the significant saving for healthcare systems. Generic drugs, which are drugs where the patent has expired, save the US healthcare system about 293 billion annually and the European healthcare System 100 billion.
All four business segments have a high potential for growth in the future years.
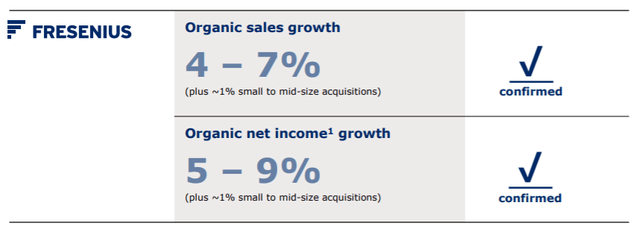
Fresenius has confirmed its growth expectations for up to 2023 with 4-7% in organic sales growth and 5-9% organic net income growth. The guidance is a good example of a company trying to scale its business and have a substantial cost reduction plan meaning more growth in the net income than revenue. Therefore, the company tries not to use the money just to generate revenue. The focus is clearly on delivering long-term sustainable business returns.
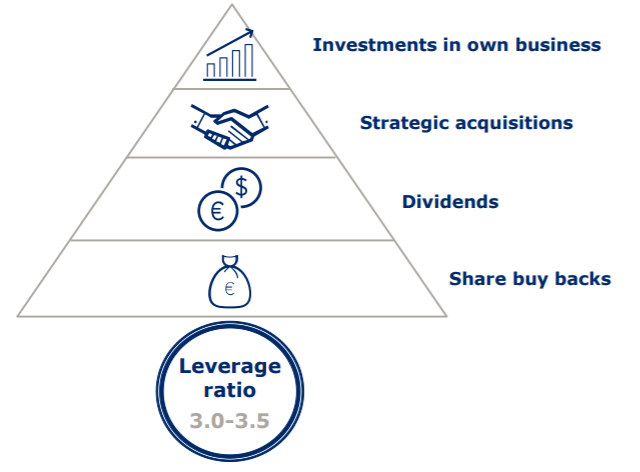
Fresenius wants to focus the capital deployment on sustainable value creation and reward shareholders with dividends and share buybacks. The limit of the leverage ratio is 3-3.5.
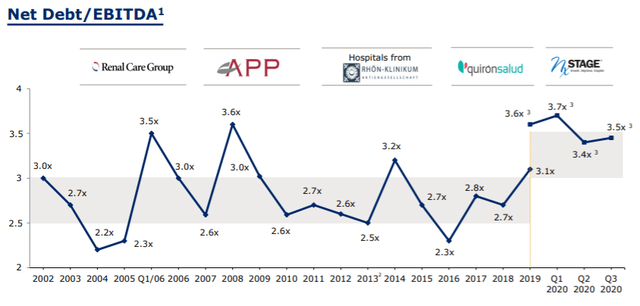
Over the last 18 years, the goal has been achieved, even with a few acquisitions that lead to a spike in the Net Debt/EBITDA ratio. Fresenius was able to deleverage then in the following years. In the COVID crisis of 2020, the leverage ratio increased as the company had issues even when operating in the health care business.
Let’s dig deeper into the business segments and the effects of COVID.
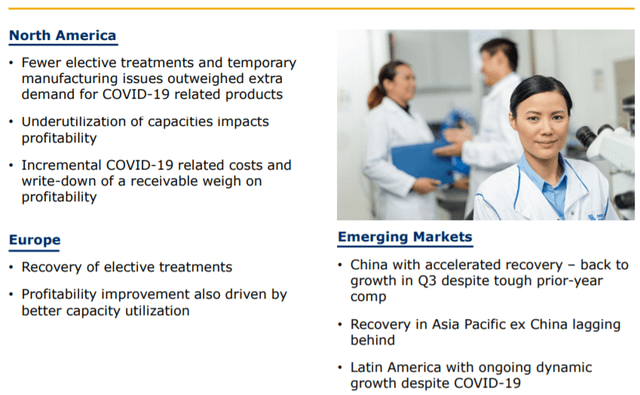
Fresenius Kabi has problems in North America as fewer elective treatments and temporary manufacturing issues outweighed extra demand for COVID related products. Also, the capacities are underutilized, costs rose, and write-downs had to be done. In Europe, the elective treatments have already recovered, and the profitability improves as the capacity has a higher utilization. The emerging markets are accelerating, especially China, but the Asia Pacific region is still lagging behind without China. In Latin America, the growth is still ongoing despite the pandemic. The biosimilars are gaining traction in the European market. Fresenius Kabi offers competitive products and focuses on the optimization of the cost base.
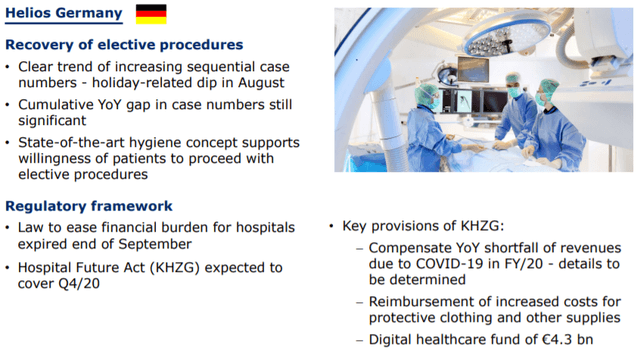
Fresenius Helios achieved a sales growth in Q3 but the cumulative year over year gap in case numbers is still significant. The German Hospital Future Act is expected to reimburse the increase of protective clothing costs and other supplies and compensate a year over year shortfall of revenues due to COVID. How fast these funds will be available for Fresenius is not clear as the payment by the German government is chaotic and taking a long time. In Spain, the recovery of elective procedures is driven by outpatient treatments. The Spanish government also has a special program to reimburse Fresenius. The rates are in line with the expectations.
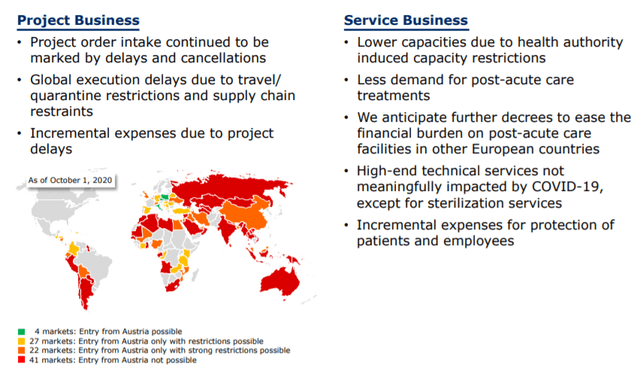
Fresenius Vamid has more problems as global execution delays due to travels and quarantine restrictions, and supply chain restraints.
But COVID is not only negative for Fresenius.
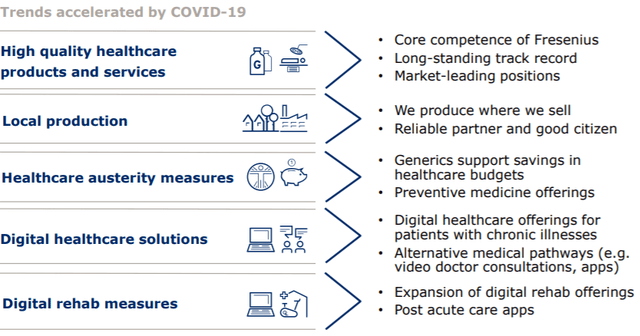
The governments and general people appreciate high-quality healthcare products and services and local production, especially since the pandemic. Fresenius has a strong track record of delivering these products and services. For governments also the saving in generics is an important point, where also Fresenius is highly active. Digitalization does not stop in front of the healthcare sector, and therefore Fresenius offers, for example, video doctor consultations or apps for post-acute care and digital rehab.
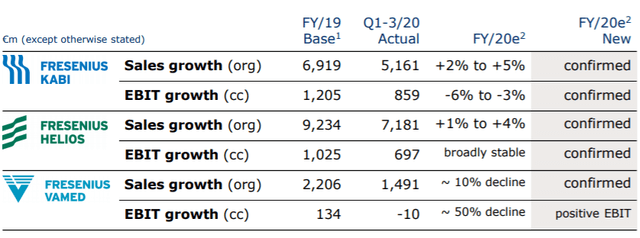
Fresenius already confirmed the outlook for their business segments. The most significant decline is in the EBIT of Fresenius Vamed with about 50%, but it is not that much of an impact as it is the smallest segment. Fresenius Kabi is expected to decline by 3 to 6%, and Fresenius Helios is expected to be stable.
Besides all these trends, the business faces some risks. One of the most significant risks is the strong dependency on the government and their health care spending. The achievement of growth is difficult to fulfill as negotiating with the government is not easy. Higher profits for Fresenius make the government not look that good. Therefore, Fresenius’s goal is to keep the current level but, on the other side, cut costs to improve the margin.
Another risk, especially for Fresenius Medical Care, are alternative treatments for kidney dialysis. As soon as the medicine is developed, the business segment loses one of its major revenue generators.
Fresenius stock analysis – Dividend
Fresenius has a solid track record of paying out a dividend for the shareholder with about 20-25% of the net income.
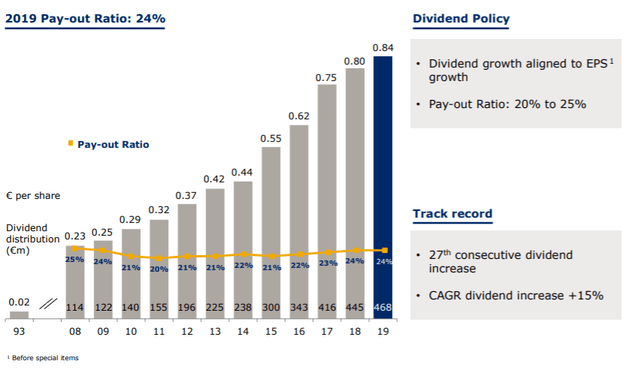
The company was able to increase the dividend for 27 years and with a 15% annual increase. The payout-ratio is relatively small, but it assures that the company has enough liquidity to take advantage of possible acquisitions and not stretch the leverage too high.

In total, Fresenius has 25.9 billion in debt and lease liabilities. If we take just the financial debt of 19.7 billion with a 2% interest rate, the yearly interest payment equals 394 million EUR or a fourth of the free cash flow.
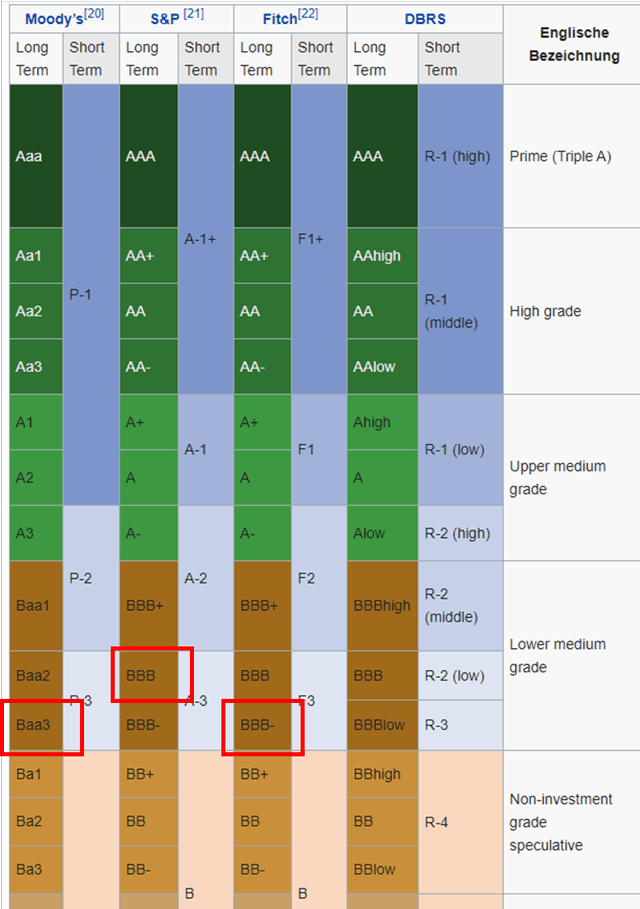
Fresenius can refinance its debt and can profit from the low-interest rates. Its credit rating is on the lower medium grade. As the outlook is stable from all three rating agencies, it is very unlikely that the company gets downgraded. It has to be mentioned that the next grade would be non-investment grade.
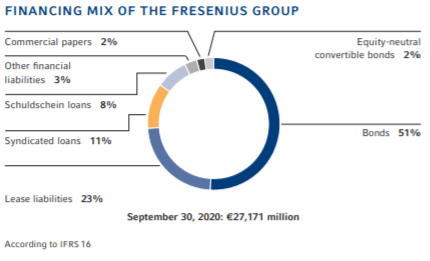
The financing mixture is reasonable as 51% of the debt is raised by bonds, but still, in total, the debt is relatively high. Fresenius is a leveraged company, using the debt to acquire new companies.
The acquisitions impacted the balance sheet and not just with the high debt level but with goodwill. 27.9 billion EUR are in goodwill, which raises the risk of extraordinary depreciation and, therefore, lowers earnings. These depreciations have not the consequence of an outflow of cash, but only mean the company paid too much for their acquisitions. The goodwill describes an intangible asset. The portion of the purchase price that is higher than the sum of all the assets purchased is listed on the balance sheet. Fresenius could have paid more for patents, brands, or a customer stock as not all assets are shown on the balance sheet.
Fresenius stock analysis – Financial discussion
Besides the strong track record of the dividend, the total shareholder return was also impressive.
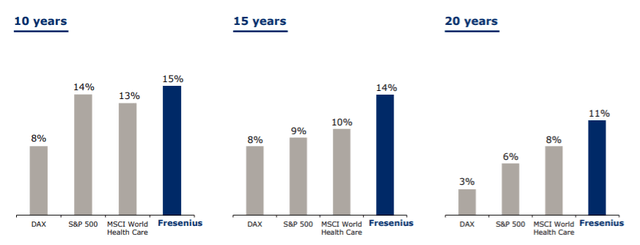
In the last ten years, Fresenius returned annually 15% and outperforming every relevant index. The difference increases if the time period increases. The data is with dividends reinvested and as of December 31, 2019. However, the stock did decrease another 30% since the end of 2019. Therefore, the return is not any longer above the return of indexes.
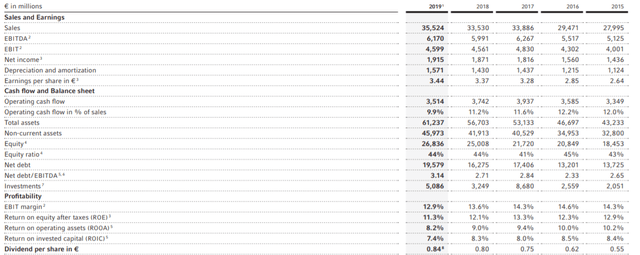
Fresenius grew revenue by about 5% annually in the past five years and the EBIT by about 3%. The margin decreased from 14.3% to 12.9%. The operating cash flow nearly stayed flat. These numbers cause a weak stock performance as Fresenius delivers on the lower end of their expected range but significantly increases the debt. Additionally, the Return On Invested Capital (ROIC) is declining in the past five years.
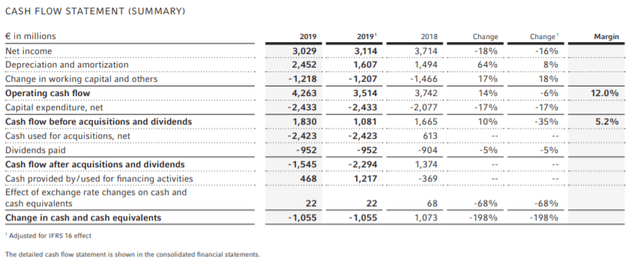
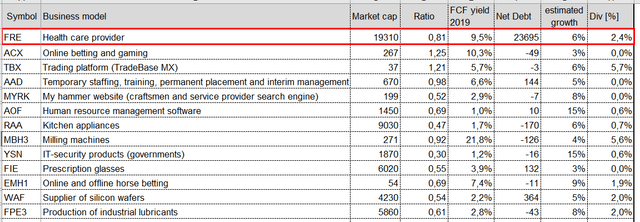
The free cash flow for 2019 was 1.8 billion EUR and equals a yield of 9.5%. But there is an issue. In 2019, the net income was 3.029 billion EUR, yes. However, that is not the net income that is attributed to the shareholder of Fresenius. Fresenius Medical Care and Fresenius Vamed are not entirely owned but consolidate their earnings to Fresenius. After deducting the non-controlling interest, the net income attributed to Fresenius shareholders is 2.023 billion EUR. Many companies do not make the distinguishment in the cash flow statement, but as the non-controlling interest is relatively high at Fresenius, it is worth a look.
Depending on what percentage of the CAPEX can be attributed to Fresenius, the free cash flow is likely to be lower by about 30-50%. Therefore, somewhere between 900 million EUR and 1.2 billion EUR or only a 5-6% yield.

A dividend valuation model will give a rough stock price valuation. This model’s general assumptions are a discount rate of 10% and a terminal multiple according to the underlying growth. The model uses the dividend as it is the cash flow that is distributed to the shareholders.
In the model below are three scenarios:
- Scenario 1 (normal case): 6 % growth (historical EBIT growth) for 10 years with a 60 % probability
- Scenario 2 (best case): 15 % growth (historical dividend growth) for 10 years with a 20 % probability
- Scenario 3 (worst case): 3% growth for 10 years with a 20 % probability
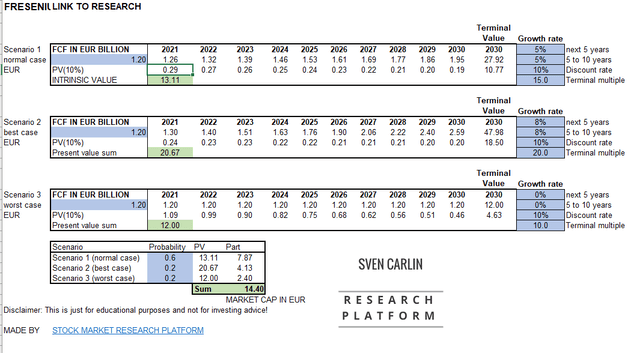
Fresenius stock price valuation – Source: Intrinsic value template Sven Carlin
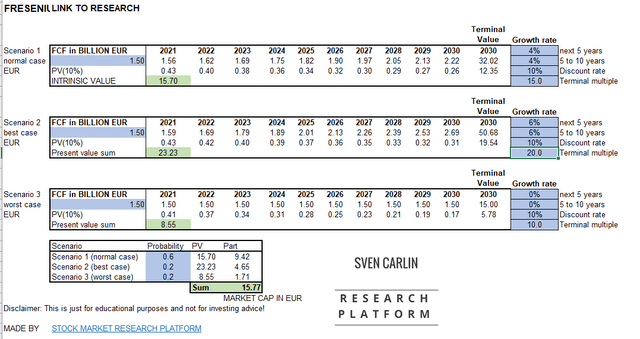
Fresenius Medical Care stock valuation – Source: Intrinsic value template Sven Carlin
Based on this model, the investor could expect a return of 7% annually with the current stock price and the assumption form above. The real cash flow yield (after deducting the non-controlling interest) is near Fresenius’s calculated long-term return.
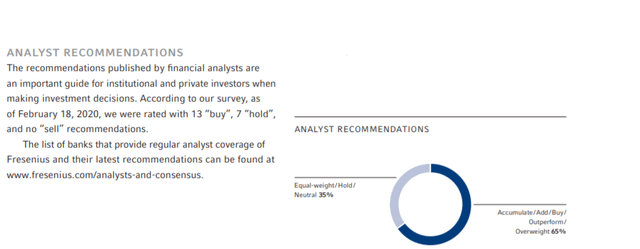
Fresenius stock analyst recommendations – Source: annual report 2019
13 Analysts rate Fresenius as a “buy”, seven analysts as a “hold,” and nobody recommends to “sell.”
With a dividend model, that looks at just the dividend and not the consolidated cash flows, things look much different.
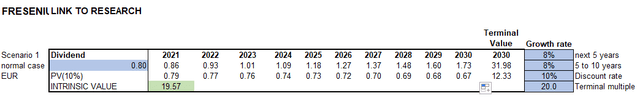
The stock price for a 10% discount rate expecting a 5% yield in 2030, falls to 19.57 EUR.
Fresenius stock analysis – Conclusion and investment outlook
Fresenius operates in a business within a strong secular trend, and the company is positioned very well to benefit from the aging world population. The risks are mostly attributed to the balance sheet (debt level and goodwill). The company also struggled to deliver targeted growth rates.
Additionally, the cash flow statement is slightly misleading. Investors can expect a 7% return over the long-term from Fresenius as the moat is still sustained. The rebuild the whole company would not be easy. It would talk a lot of money, know-how in the medical industry, and additional licenses from various governments for the healthcare sector.
In comparison to other german stocks, Fresenius is still valued relatively cheaply, especially for the large-caps. For small-caps, there are better options. But it has to be mentioned that our german stock overview has just started so we hope to find better. There are 30 to 40 more stocks that will be analyzed over the next weeks.