Understanding the Intrinsic Value of the S&P 500: A Guide for Investors
Contents:
Check out the full video on YouTube, if you prefer reading however, keep scrolling.
Investing in the stock market is not just about price; it’s about understanding the intrinsic value of an investment. Intrinsic value helps investors gauge potential returns, assess risks, and determine how an investment aligns with their financial goals and portfolio. In this article, we’ll break down the intrinsic value of the S&P 500, using a structured approach to evaluate its earnings, growth, and valuation. By the end, you’ll have a clearer picture of what to expect from this benchmark index and how it fits into your investment strategy.
What is Intrinsic Value?
Intrinsic value represents the true worth of an investment based on its fundamentals, such as earnings, growth potential, and valuation. For the S&P 500, this involves analyzing its earnings per share (EPS), dividend payouts, growth rates, and the expected return compared to other investment opportunities. By understanding these factors, investors can make informed decisions about whether the S&P 500 is overvalued, undervalued, or fairly priced.

Intrinsic Value Calculation Template by Sven Carlin (free download on Value investing course)
Key Inputs for Calculating Intrinsic Value
To calculate the intrinsic value of the S&P 500, we focus on four key inputs:
- Earnings or Dividends: The earnings per share (EPS) or dividend payouts provide a foundation for valuation.
- Growth Rate: The expected growth rate of earnings or dividends over time.
- Discount Rate: The expected return an investor requires to justify the investment.
- Valuation: The price-to-earnings (P/E) ratio or other valuation metrics that reflect the market’s pricing of the index.
Analyzing S&P 500 Earnings and Dividends
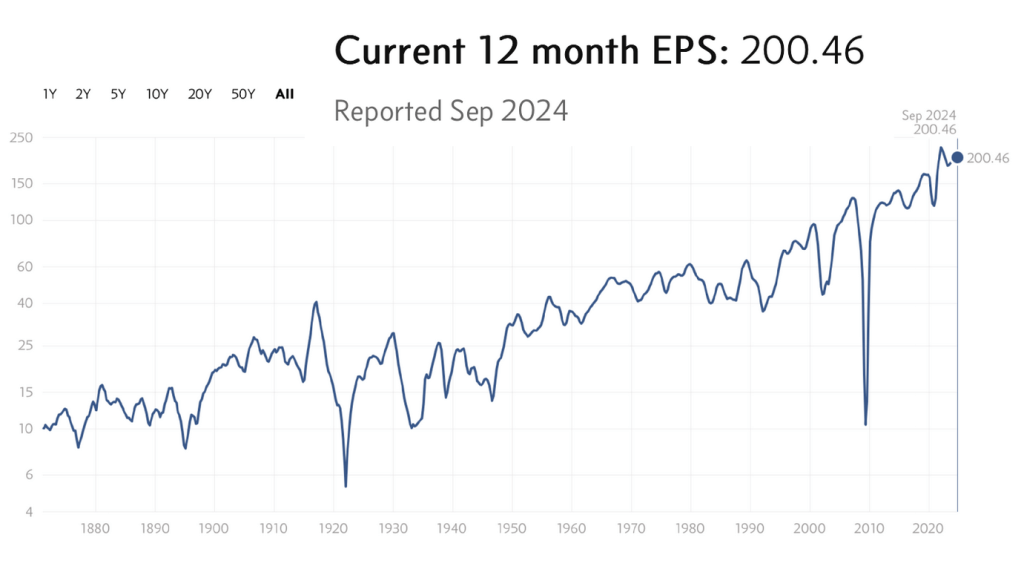
As of the latest data, the S&P 500 reported earnings of 200 points, with a dividend payout of 75 points over the past 12 months. This translates to a dividend payout ratio of 37.5%. Using these figures, we can project future cash flows and calculate the present value of dividends paid out over the next decade.
Estimating Earnings Growth
Historical data provides valuable insights into the S&P 500’s earnings growth. Over the past 50 years, earnings have grown at an average annual rate of 7%, driven by a combination of inflation, economic growth, and business expansion. However, growth rates vary significantly by decade. For instance, from 1979 to 1991, earnings grew at a slower pace, while the period from 2009 to the present saw stronger growth.
Given the potential for slower economic growth in the future, a more conservative estimate of 6% annual earnings growth is reasonable. This accounts for potential recessions, changes in tax policies, and other macroeconomic factors.
Valuation and Expected Returns
The S&P 500’s current P/E ratio is 30, significantly higher than its historical average of 15. This suggests the index is trading at a premium. To calculate intrinsic value, we assume a terminal P/E ratio of 15, reflecting a return to historical averages. Using a discount rate of 10% (the expected return for comparison), the intrinsic value of the S&P 500 is estimated at approximately half its current price.
However, if the P/E ratio remains elevated at 30 over the next decade, and earnings grow at 6% annually, the intrinsic value aligns more closely with the current price of around 6,000 points. In a worst-case scenario—where growth slows to 4% and the P/E ratio contracts to 10—the intrinsic value drops to 1,655 points.
Risk and Reward Considerations
Investing in the S&P 500 is not without risks. Historical data shows that real returns (adjusted for inflation) have varied significantly over time. For example, during the 20-year period from 1961 to 1981, real returns averaged just 1% annually. Even over longer periods, real returns have typically ranged between 3% and 7%, far below the often-cited 10% benchmark.

Key risks include:
- Economic Recessions: Periods of slow growth or contraction can significantly impact earnings.
- Valuation Contractions: A decline in P/E ratios can erode returns even if earnings grow.
- Policy Changes: Higher corporate taxes or changes in interest rates could affect profitability.
How Does the S&P 500 Fit Your Portfolio?
Understanding the intrinsic value of the S&P 500 helps investors manage risk and align their investments with their financial goals. If you’re seeking a 10% annual return, the current valuation may not justify investing in the index. However, if you’re comfortable with a 5-6% return over the long term, the S&P 500 could still be a viable option.
It’s also important to consider alternative investments. For example, paying down a mortgage with a 5-7% interest rate offers a guaranteed return, which may be more attractive than the uncertain returns of the stock market.
Conclusion
The intrinsic value of the S&P 500 provides a framework for evaluating its potential returns and risks. While historical growth rates and valuations suggest the index may be overvalued, conservative estimates still point to modest long-term returns. By understanding these dynamics, investors can make informed decisions that align with their financial goals and risk tolerance.
Remember, investing is not just about chasing returns—it’s about managing risks and ensuring your portfolio supports your long-term objectives. Whether you choose to invest in the S&P 500 or explore other opportunities, a disciplined approach to valuation and risk management will serve you well.

Value Investing Risk & Reward Quadrant (check all the stock analyses)