
Tesla Stock Market Capitalization Valuation Test Tool (Think Long-Term)
When it comes to analyzing the potential of a growth stock, especially of those stocks where there are many exuberant forecasts, a good tool to use is the market capitalization test tool.
The market capitalization test tool simply compares the market value of the company to what the fundamentals should grow into in the future to justify the current stock price. To explain the market cap tool, I will use Tesla’s stock market capitalization example.
Article content:
- Tesla’s stock market capitalization and related fundamentals
- Tesla number of shares outstanding
- Tesla’s fundamentals versus market capitalization
- Tesla market cap test examples
- Tesla $7,000 stock price forecast
- Market capitalization tool test conclusion
If you prefer watching and hearing me blab more about Tesla stock, please enjoy the video:
Tesla stock market capitalization and related fundamentals
The market capitalization of a stock is equal to the number of shares outstanding multiplied by the share price.
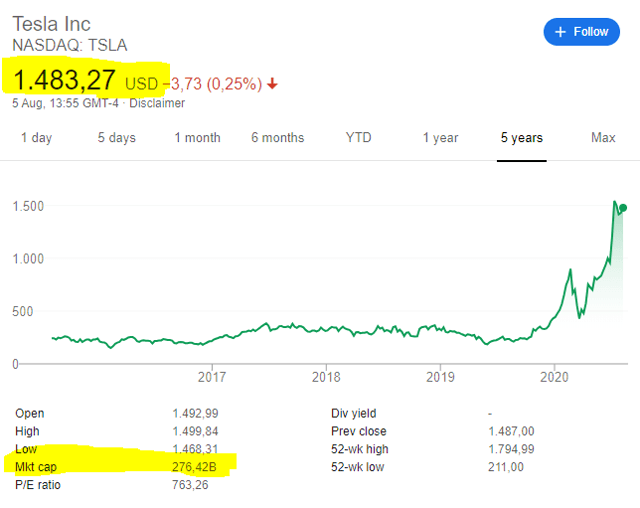
As I am writing this, TSLA stock price is at $1.483.27.
Tesla number of shares outstanding
You can find the most updated number of shares outstanding in the latest financial report, SEC filing 10Q. In this case, within Tesla’s Investor Relations page.
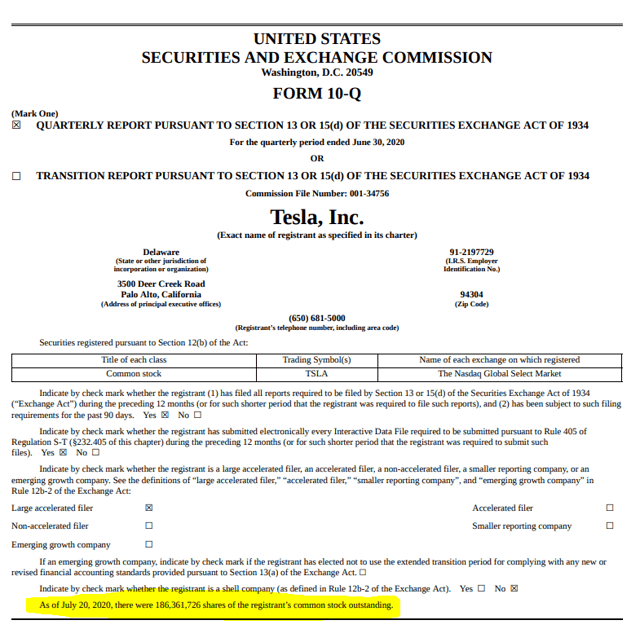
If I multiply 186,361,726 by $1,483.27, I get $276,424,757,324.02. So, both me and Google are correct.
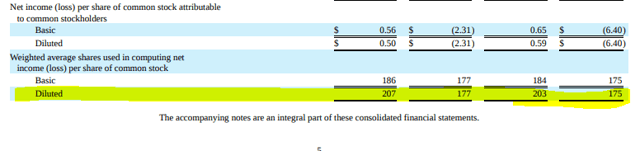
A short note here, the above number doesn’t include the shares that will most likely be issued in the form of option stock rewards or coming from convertible bonds. If you add those, you get to the diluted number of shares outstanding which is 2017 million for Tesla.
A dilution of 11% is already a significant number. Investors might want to take that into account when calculating future earnings and possible dividends because those are going to be divided by a bigger number in the future as the number of shares outstanding in the future will be higher.
Let’s connect the above with the fundamentals.
Tesla’s fundamentals versus market capitalization
Tesla’s market capitalization is $276 billion while its ttm (trailing twelve months) revenues were $25.7 billion. This gives us a price to sales ratio of 10.73. You might argue the price to sales ratio is not even that high as Apple is at 7.1 and it is a Buffett owned stock.
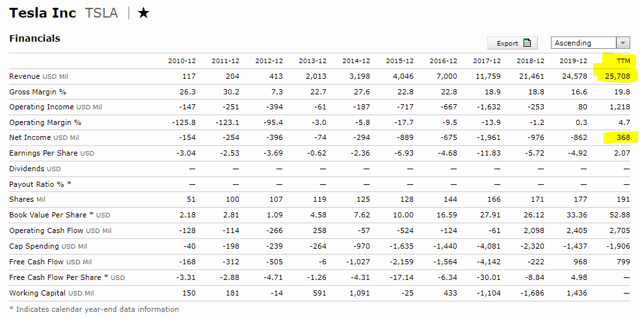
However, Apple’s profit margins are a bit better. Tesla earned 368 million on $25.7 billion in revenue which gives it a net profit margin of 1.4%. On the other hand, Apple earned $58.4 billion on revenues of $273.8 billion for a profit margin of 21.3%. Some say Model 3 and Y margins will be 20%, but the points here is not to argue about Tesla, but to discuss the tool that will help you make your own decisions.
Apple’s current price to earnings ratio is 27 which gives a 3.7% earnings return (100/27). Let’s say that a 3.7% earnings return is also something a long-term investor in Tesla hopes to achieve as we can compare current Apple to future Tesla because apple has reached its maturity level while Tesla is still a growth stock. Here we come back to the market capitalization.
Tesla market cap test examples
In order to give investors a return of 3.7% on a market capitalization of $276 billion, Tesla needs to earn 3.7% of $276 billion which is $10 billion per year. So, if the company manages to reach a 10% net profit margin and quadruples its revenues by 2030, then the current valuation would be equal to Apple’s. The only very significant difference being that Apple is already there and if Tesla quadruples its revenue and increases its net profit margin up to 10% by 2030, only then it would be at the same valuation level. And, 10 years when it comes to investing in a lot.
For example, if you wish to get a 7.2% yearly investing return from your investment, your stock has to double over 10 years. Thus, based on the above Apple valuation comparison, to reward shareholders with a 7.2% return, Tesla would need to increase revenues 8 times and increase profit margins to 10% by 2030.
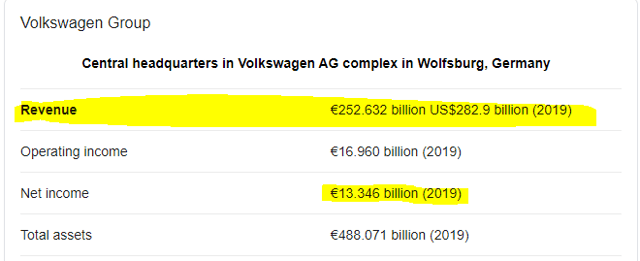
This means Tesla’s 2030 revenues would have to be at $205 billion with a net profit of $20 billion. With a PE ratio of 27, the market cap would only double by then. I am not saying this is not possible as the Volkswagen group has similar revenue levels with albeit a lower net profit margin.
I don’t know Tesla well enough to assess whether will Tesla reach the above level in 2030, but the point of this simple method is to give perspective from a market capitalization perspective.
Tesla $7,000 stock price forecast
I have found even more exuberant Tesla stock analyses where the stock is forecasted to reach $7,000 by 2024. A $7,000 stock price would imply a market capitalization of $1.449 trillion if we multiply the price with the diluted number of shares outstanding of at least 207 million.
To have a price to earnings ratio of 27, like Apple has now, Tesla would have to earn $53 billion per year in net profits. Even with a 20% profit margin like apple has, the revenues would have to be at $265 billion. So, to reach such expectations the business would have to increase sales by 10 times over the next 4 years and increase its margin by 14 times too.
Market capitalization tool test conclusion
If you are investing, you will constantly hear about exuberant forecasts and great stock market investing opportunities. An example is the 3D printer revolution in 2014 with the 3D Systems stock.

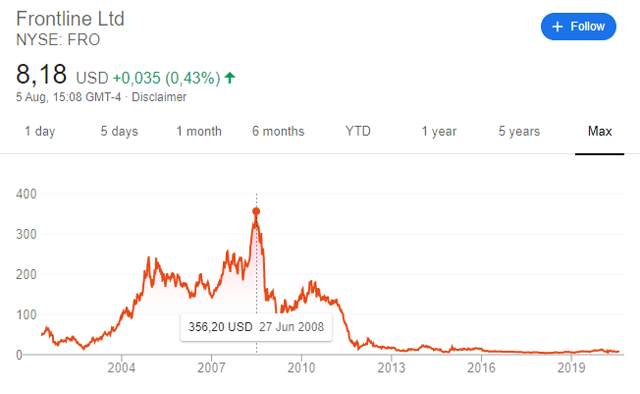
Tesla’s stock chart resembles the above but in 2008 there has been exuberance also in more boring industries. Shipping stocks were expected to grow perpetually.
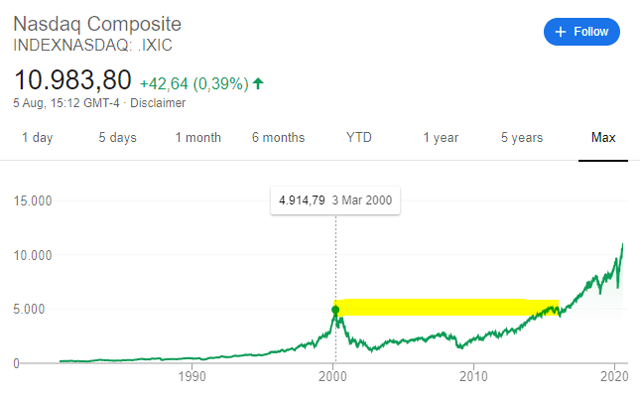
And we all know about the late 1990s when every stock that had something like ‘net’ or ‘com’ withing its name was doing greatly. It took 15 years for the NASDAQ index to reach its 2000 high of 5,000 points.
The internet did change the world, but investing is about having the right expectations at the right moment in time alongside realistic forecasts and possibilities. If you go around telling people how you are going to make a lot of money doing this or that, be sure many of them will try to take a piece of the cake too. The same applies to business and many competitors are already trying to eat Tesla’s cake.
I hope the market capitalization tool helps you put things into perspective when it comes to promising growth stocks. Some of those will do greatly over time like Amazon did, but knowing what is the business potential will give you a good assessment of whether it is a good time to jump in or not.
If you enjoyed this, please sign up for my completely free stock market investing course where you can find similar lectures that will make you a better investor.
For my stock analyses, please sign up to my newsletter: