
Inelastic Market Hypothesis – You Crash Markets
Who Moves Stock Prices? You Do! Inelastic Market Hypothesis Explains Market Volatility. Here is the less technical video, article explaining the inelastic markets hypothesis continues below.
Inelastic Market Hypothesis
Professors Gabaix from Harvard and Koijen from Chicago Booth recently came out with a very interesting paper explaining why the stock market is so volatile and what is the impact various stock market players have on stock prices; from households with investors like you and me, to governments, institutional investors and corporations with their buybacks.
They created a new framework called the “Inelastic Market Hypothesis” and I think they are on a good path to win a Nobel prize in economics just like Eugene Fama did for the “Efficient Market Hypothesis”.
Both their theoretical and, most importantly, empirical findings confirm that:
On aggregate $1 invested in the stock market increases the value of the market by $5.
For me, this is a mind-blowing fact, their work gives an answer to the mystery of apparently random movements of the stock market, that are hard to link to fundamentals. The market mystery is replaced by a more manageable problem of understanding the determinants of flows in inelastic markets. The factor at which new flows impact prices ranges from 3 to 12 depending on the sector.
One example of the mystery where and why stocks don’t follow fundamentals, is that in 2020, to quote Greenblatt: “If an investor bought shares of the 261 companies with a market capitalization of more than $1 billion that lost money last year, they would be up 75% year-to-date through September”.
Perhaps the best example of Greenblatt’s statement is ARK Invest, the fund that invests only in technologically disruptive companies that often don’t make money, but the performance has been staggering in 2020 – up 100%.
Let’s dig into the inelastic markets hypothesis framework that will allow us understand the stock market much better. I hope I add value to you buy translating the content from an academic to a more practical explanation.
What moves stock prices – explaining market volatility with the inelastic markets hypothesis
What happens if an investor sells $1 of bonds and buys $1 dollar of stocks?
Countering to the efficient market hypothesis, where nothing is expected to change in respect to aggregate market values, according to the inelastic market hypothesis; one dollar invested in the stock market increases the value of the stock market by five dollars.
The authors back up their thesis with the inelasticity on the stock market, where it doesn’t change relative to changes in stock price and call it the “inelastic markets hypothesis”.
The thing is that if you wish to buy $1 of stocks, there is not enough supply for you to do so without having a significant impact on the market. This is due to the following four reasons:
1) Institutional funds are often constrained, i.e. have pretty firm positions (be it 100% equity or 70% equity)
Institutional investors do their thing and don’t change no matter what happens on the stock market, whether the S&P 500 is at 666 points like it was in March of 2009 or at 3,500 points like it is in November 2020.
2) There are not enough arbitrageurs to supply you with the $1 of stocks you wish.
Hedge funds make only 5% of the market and in bad markets, they actually have to reduce their positions because of outflows. (Ben Davis at all 2012) With hedge funds being so small, there is nobody that takes the other part of the market and goes short correct market imbalances. Many have tried with Tesla, but it didn’t work, the power of retail investors was and still is much bigger.
3) The transfer of equity risk across asset classes is small (about 0.6% of the aggregate value of the equity market per quarter for the average pair of investor sectors). This means not much changes within markets confirming the point above and this also might be the advantage Ray Dalio has over others as he is constantly balancing his risk across various asset classes, something the market doesn’t do at all.
For example, given the fixed allocations, an inflow of $100 billion, thus just 0.3% of the $30 trillion S&P 500 market, would be very significant for the market, as would a similar outflow. There is not enough balancing across classes to bring balance to individual asset classes.
4) The macro elasticity of the market is likely below 1 as the micro is around 1. The market is efficient in specific situations that are quickly arbitraged, but not on aggregate.
These 4 pillars of the inelastic markets hypothesis allow us to understand better what drives the markets and what creates booms and crashes. You might be surprised, but given the above, it is actually households that mostly impact markets.
You create market crashes – households panicking and selling just 0.5% of the market
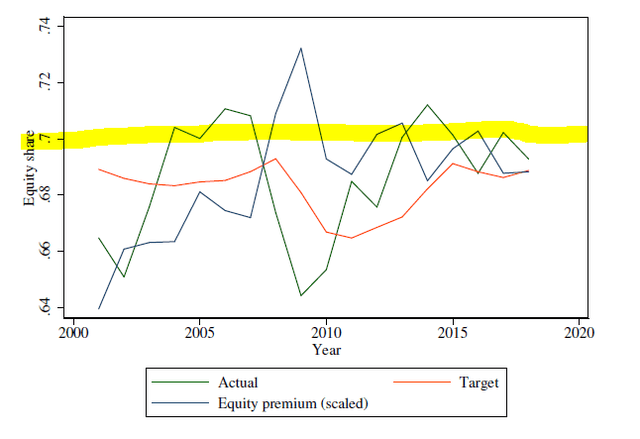
Since 1993, equity ownership in the United States shifted from households to institutions but equity allocations have been pretty stable there over time, which leads to inelastic markets and confirms the fact that households drive the market, i.e. you drive the market.
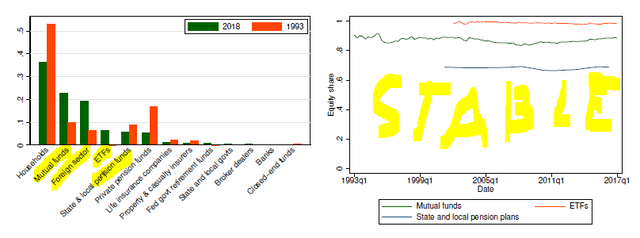
How does this work during crashes – well households are those that panic, run to rebalancing and drive the market, while institutions largely stick to their equity share allocations.
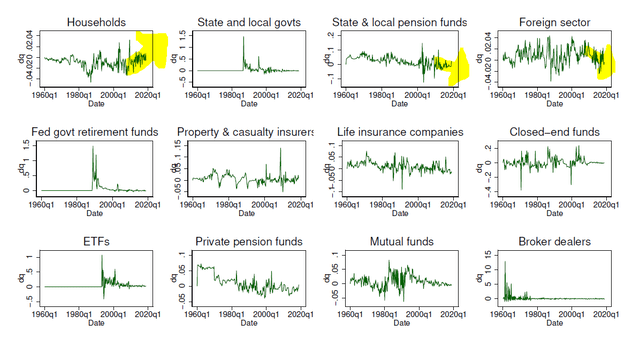
The below figure shows how households sold only 0.5% of the market during the dot-com crash, but that was sufficient to drive the market down 50%. Similarly, during the 2008/2009 crash, households again sold just 0.6% of the market, and again drove markets down.
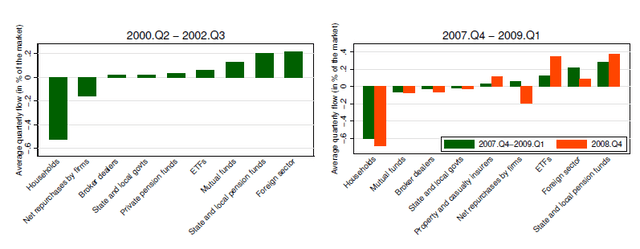
The foreign sector, pension funds and mutual funds actually contributed to make things better during the period while companies stopped with buybacks and negatively impacted the market.
The conclusion is that you, more than anyone else, make the market move. Mutual funds follow, again likely under the pressure of households that add money when things go well and detract when things look bad.
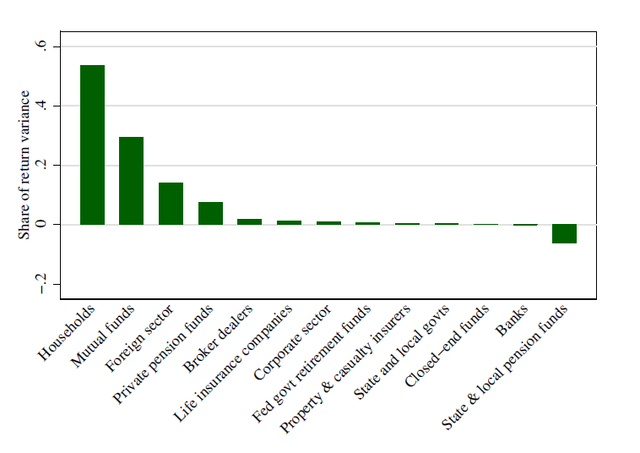
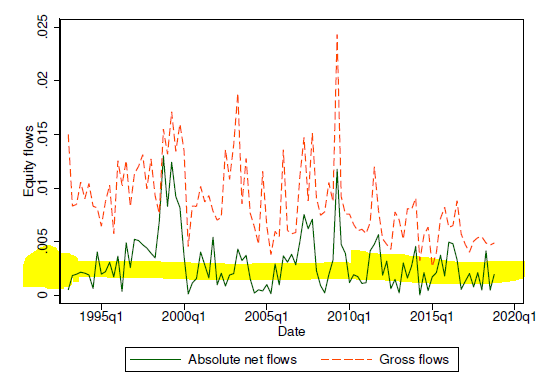
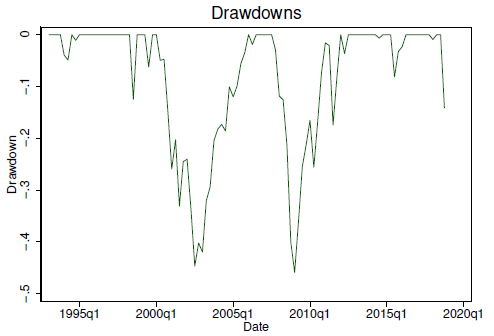
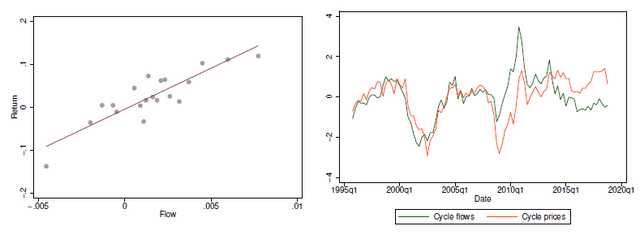
If we look at how flows impact stock prices, well the correlation is pretty clear and the right chart doesn’t need much words. The authors find that the inelastic markets hypothesis based on flows, explains 30% of stock market movements.
If we take a look at the longer term, it is clear that households have also been behind the latest 10-year bull market as flows have been extremely positive there and growing. Plus, flows have been larger than with any other sector and during the bad 1970s, households were those running away from stocks.
This creates very important consequences when it comes to how markets were understood up till now, how will markets hopefully be understood in the future and consequently on how we invest.
The importance of the inelastic markets hypothesis
The authors find that:
- Roughly over one third of all stock market fluctuations are driven by capital flows because markets are inelastic. This means that we can replace the invisible hand driving the markets with something tangible, which makes a big difference in how markets should be viewed.
- There is no seller for every buyer!
- Stock market price movements can be explained by flows with certain investors. In this case mostly households or retail investors which means that our dollar is extremely important.
- Government intervention matters – something governments aren’t much concerned when making policy decisions and taking market actions but if they increase flows, this has immense impacts on markets.
- Corporate buybacks impact can be quantified – as investors we should be able to understand the impact of a buyback and consequently also the value to shareholders of it based on the flows in relation to the specific elasticity of the security. You could also trade on this as companies announce their buyback activity. To quote: “as share buybacks account for a large portion of flows (they have been about as large as dividend payments in the recent decade), corporate actions account for a sizable share of equity purchases, and hence of the volatility and valuation growth of the stock market.”
- Their models are at odds with traditional theoretical models, but also with the prevailing common wisdom in their profession and should be considered when making policy decision or when investing, for us retail investors.
Inelastic Market Hypothesis Impact on Investing
One could think that looking into fundamentals, balance sheets, assessing future profitability, dividends and cash flows doesn’t matter and that all one should follow is the flow of funds.
That might be correct if we follow the inelastic market hypothesis, but one must never forget the words of great value investors like Schloss, Klarman, Buffett and others; that it usually takes 2 to 5 years for the value to unlock and sometimes even more than that.
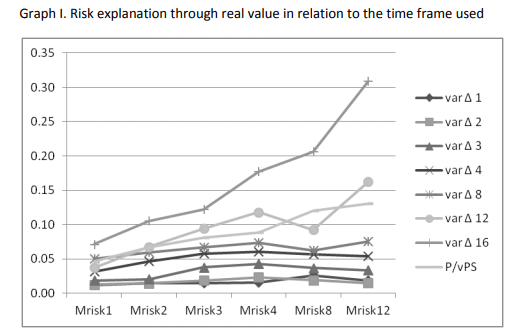
My Ph.D. has been on a similar topic, on a smaller scale and market, where I have found that the market certainly doesn’t follow fundamentals over the short-term, but the significance of fundamentals increases the longer is the period analyzed. When I looked at how a change in fundamentals impacts stock prices in the short term (one quarter equals Mrisk1), very little of the market fluctuations were explained, but when I looked at the same over 12 quarters, more than 30% of market fluctuations were explained by one fundamental factor.
Perhaps if we look at how flows follow fundamentals over the very long-term, we could find that there is some correlation. Common sense tells me how over the long-term, fundamentals will certainly drive investment returns, and it is Buffett’s saying how:
“Over the long-term, investment returns are perfectly correlated to business fundamentals”.
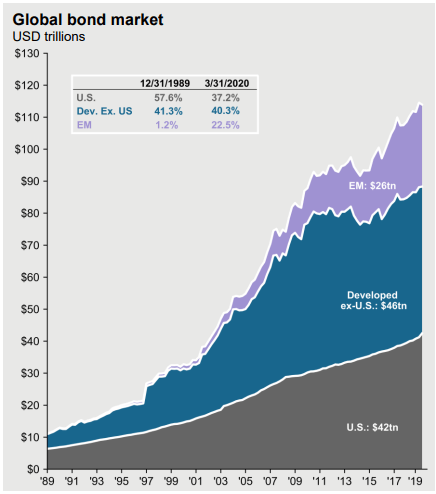
The only problem is that we can never know how long is long-term and how short or long is short term. In the 1990s investors waited years for the market to get some sense, these days with interest rates at zero, we might wait decades or more. If we just compare the market capitalization globally for bonds and stocks and apply the above research, we see there is potential for stocks to double and more in the future, no matter what we think of fundamentals.
The S&P 500 at 7,000 Points – Comparing market capitalizations and impact of bonds and stocks
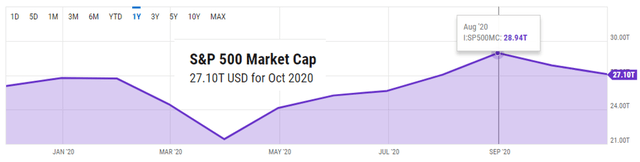
With the stock market, in this case the S&P 500, having a capitalization $27 trillion and the U.S. bond market having a capitalization of $42 trillion, just $6 trillion switching from bonds to equities in the U.S., which is similar to what the FED injected in funds over the last year, could push equity markets to double according to the inelastic markets hypothesis.
If $5.4 trillion decide to go from bonds where yield are minimal and the risk, in the form of possible inflation and increasing rates, is high, following the thesis that $1 of flows increased the value of the market by $5, the $5.4 trillion could push the market up by $27 trillion and the S&P 500 could be at 7,000.
Fortunately, the is not much switching between asset classes, but if bond investors get bored of the low rates, it could have a huge positive impact on stocks.
Globally the situation could be even more impactful as bond markets are larger than equity markets or if international funds from bonds, turn again to U.S. equities.
All in all, the inelastic market hypothesis is very interesting and could grow into something meaningful (hm, that is debatable), I better say notorious, like the efficient market hypothesis.
Interested in more stock market research and summaries like this one, subscribe to my newsletter.