Berkshire Hathaway – Intrinsic Value Calculation
Contents
- Defining intrinsic value
- Berkshire’s return on invested capital
- Berkshire’s future cash flows
- Insurance business
- Railroads, manufacturing, utilities and other from lollipops to locomotives
- BRK’s stock market portfolio
- Berkshire Hathaway’s PE ratio
- Berkshire – investment thesis
Summary
- Berkshire’s intrinsic value depends on your required investment return (read – discount rate), and the valuation you assume the company will have in the future.
- If you are happy with a return that is two percentage points higher than the Treasury yield, BRK’s intrinsic value surpasses a trillion.
- The thing that strikes me the most with BRK, is that its equity portfolio has an average PE ratio of 10.
- By properly adjusting for reported and non-reported earnings, BRK’s forward price to earnings ratio falls from the current 20 to 11.6.
The secret of value investing is to buy a business below its intrinsic value. That is easy to say but hard to calculate as you first have to define intrinsic value. After having defined intrinsic value, it would help to be all-knowing about the future, so that you can also know the exact cash flows to use when calculating intrinsic value. As the future, and especially businesses, are impossible to predict, we will never correctly assess future cash flows. Nevertheless, we can try, and use the intrinsic value we get for comparative purposes.
For those that prefer the video version to the article, here it is: (article below)
Intrinsic value definition
The go to person when it comes to defining intrinsic value is Warren Buffett himself. I quote:
The value of a business is the present value of its cash flows from today to judgement day, discounted at a proper discount rate.
Therefore, to get to the intrinsic value of a company, we have to do two practically impossible things:
- Predict all the cash that a business can give us between now and judgement day, and
- Find the proper discount rate.
With any kind of financial assets, we are using our present moment cash in order to hopefully get more cash back in the future. The future cash distributions have to be attractive to us when compared to other investment opportunities or current interest rates. It is easy to use available interest rates, but then not all of us consider US Treasuries as an investable option. Therefore, I am going to leave the decision on what the proper discount rate is to you. At the end of the article you will be able to download my spreadsheet and you will see whether BRK at current levels is a buy for you or not.
I’ll first estimate the return on invested capital BRK might achieve in the future and then BRK’s cash flows.
Berkshire’s return on invested capital
On various occasions, Buffett and Munger said how their current aim is for their investment returns to be between 8% and 10%. The last significant investment where they lent $10 billion to Occidental at extremely favorable terms, shows how they can still get to such relatively high returns. In his own style, Carl Icahn clearly pointed out how the deal was amazing for Buffett because he got an 8% yield and all the upside through warrants.

Source: CNN
I think that over time, BRK will find places where to deploy its huge cash pile. It might not be today, but we can say that BRK is going to get a 7% yield on its newly invested money. The current yield on the 3-month Treasury bill is 2% and that is what BRK gets on its large cash pile at the moment. When the cash is deployed, it will probably earn more than 8%. Therefore, it should be ok to use a 7% expected return on newly invested capital in our calculations.
7% is a conservative reinvestment yield estimation. Later in the earnings model we can play with it and develop various scenarios. Let’s jump onto the cash flows.
Berkshire’s future cash flows
There are two components when it comes to BRK’s cash flow:
- the 100% owned companies where their financial statements are fully consolidated into BRK’s statements and thus their earnings are fully reflected. And,
- the equity holdings where only the dividends are reflected in BRK’s financial statements within the insurance income. Therefore, a big part of earnings is unjustly omitted.
Let’s start with the owned companies.
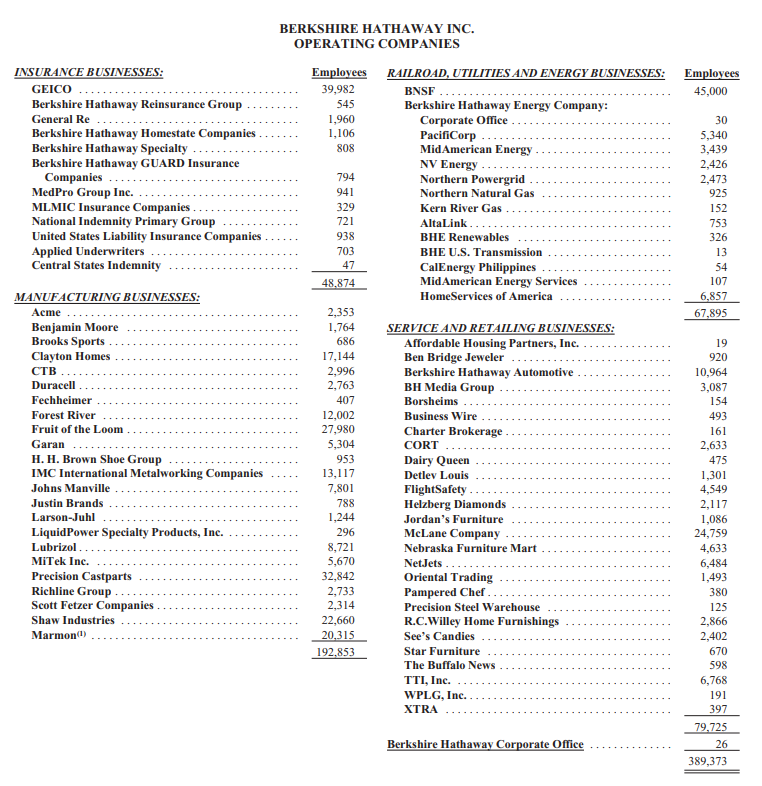
Source: Berkshire Hathaway 2018 Annual Report
To estimate the future cash flows from all of the above would be an impractical task, as we don’t have the individual financial statements for each business. Therefore, the best way to go about it, is to use the last few years as a start.
Berkshire’s insurance business – adjusted earnings
Within the insurance business, the float is what matters while direct business earnings are not so important. But when those are there, even better. Over the last 15 years, BRK’s insurance earnings were $27 billion and it is probable that their earnings remain along those lines in the future. Because of the float, insurance is a highly competitive business and therefore, it is difficult to make profit with underwriting. The difference between the premium received and the claims paid is called ‘the float’ and it is money that can be invested. The return on the float and retained insurance earnings, added $4.5 billion to the investment income in 2018 and more than $3.5 billion in the two previous years.

Source: Berkshire Hathaway 2018 Annual Report
Over time, BRK’s float has been getting bigger and bigger.

Source: Berkshire Hathaway 2018 Annual Report
BRK now enjoys $122 billion of free money at its disposal to be deployed wherever Buffett finds most appropriate. BRK can do that as it has a triple A credit rating that gives it more flexibility when it comes to insuring. Over time, a lot of that money has already been invested and has created the amazing portfolio BRK has now.
I would assume that in the future, the float will slowly grow and so will insurance earnings, with a big hit here and there due to various catastrophes. However, we can freely use $4 billion as adjusted current insurance earnings and put a 7% growth rate estimation on those.
Railroads, manufacturing, utilities and other from lollipops to locomotives – adjusted earnings
Railroads added another $5 billion last year, $3.5 billion in the previous years, utilities $2.6 billion, manufacturing, services and retailing another $9.5 billion for a total of $17.1 billion in 2018. Earnings in 2017 were just $14 billion, but we must take into account the lower corporate tax rate that increased net income.
I think that we can use $20 billion as a base for our adjusted earnings from all BRK’s 100% owned businesses, and then increase it at 7% per year over the next decade or two. Additionally, the $120 billion BRK currently has in cash, will probably be deployed, and therefore earnings might be even higher.
BRK’s stock market portfolio real earnings
The stock market portfolio is $196 billion and most of it is under the insurance umbrella. We can see in the below figure that 50% of BRK’s cash is within its insurance business and thus, the remaining part is consolidated with BRK. As the equity portfolio is within the insurance division, the dividends received have already been included under the investing income within the insurance part.
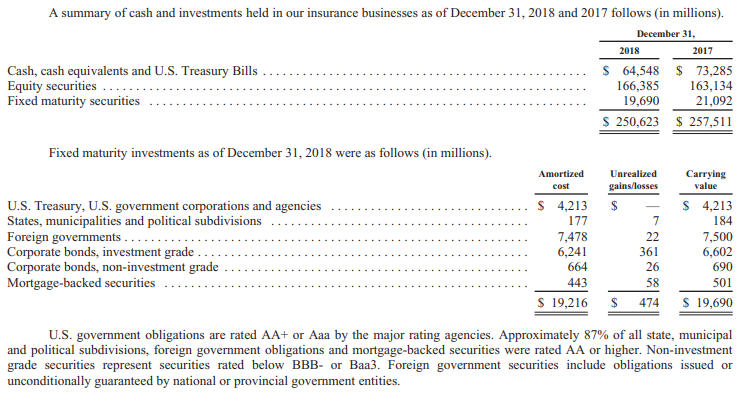
Source: Berkshire Hathaway 2018 Annual Report
What is not accounted for, is BRK’s share in earnings that its stock investments don’t pay out as dividends.
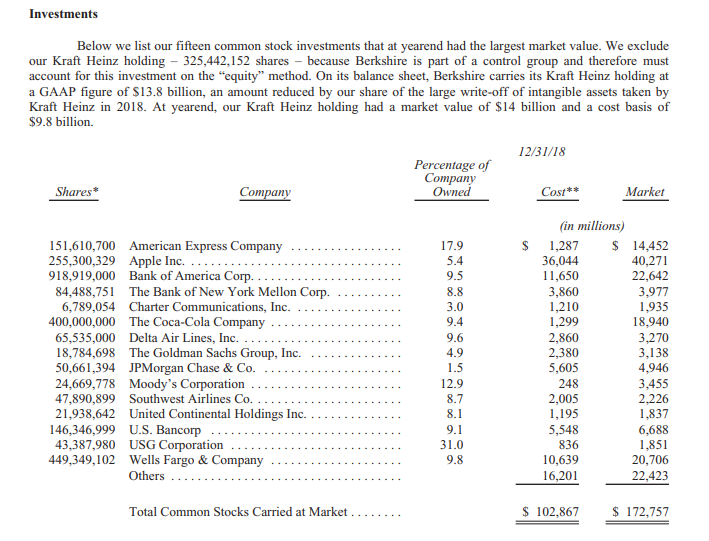
Source: Berkshire Hathaway 2018 Annual Report
To calculate the additional, non-reported earnings, we have to get the pay-out ratio for all the equity positions. I have looked at the pay-out ratio for each of the above positions and deducted the already paid dividend from the full earnings.

Source: Author’s calculations using company statements
BRK’s actual earnings, that are not reported but would be if BRK would own 100% of those companies, amount to $11 billion. That is what the equities owned earn, but don’t distribute back to BRK. Warren Buffett is happy about it as the companies owned achieve returns of 20% on the net tangible equity.

Source: Berkshire Hathaway 2018 Annual Report
If the companies owned continue to deliver similar returns on the retained earnings, we could expect growth of 20% per year on the $10 billion.
If I estimate earnings growth of 7% on the $20 billion from various fully owned businesses, including insurance, and 20% growth on the retained earnings within the equity portfolio, I end up with an average 11% expected growth rate on BRK’s earnings.
11% might sound like a staggering growth rate, but that is what Buffett aims for. The return on invested capital is exactly what will determine BRK’s future returns.
To conclude, we have $20 billion from insurance and other businesses, $11 billion from the non-reported equity holdings’ earnings and thus, BRK’s earnings are around $31 billion. Those will probably be growing at 10% per year over the coming decade or two. To be conservative, we can include a recession or two, that might slow down the long-term earnings growth to 7%. I think Buffett would still be happy with a 7% earnings growth rate.
Before digging into BRK’s intrinsic value, I wish to discuss its PE ratio.
Berkshire Hathaway’s PE ratio
By looking at BRK’s reported adjusted forward earnings, the PE ratio should be around 20. We have a market capitalization of $500 billion and $25 billion in expected earnings from the 100% owned companies, including the dividends from the equity portfolio. However, the $11 billion in earnings not included in BRK’s reports should also be added to the calculation. This would lower BRK’s PE ratio to just 13.88.
If we then remove the $100 billion in cash from the calculation ($20 billion will always be kept for insurance needs). On a market capitalization of $400 billion, BRK’s PE ratio is just 11. That should lead to a 9% long term return on investment. But that is not all that is interesting when it comes to BRK and its PE ratio.
BRK’s equity holdings have a low PE
If you look at the price to earnings ratio of BRK’s equity holdings, the average is not far from 10, if you exclude the legacy holdings like Coca Cola (KO), American Express (AXP) and Moody’s (MCO).

Source: Author’s data and company filings
I found this so interesting because it is in line with what Buffett keeps saying; that investment returns are perfectly correlated to the performance of the underlying businesses. By owning good businesses that will continue to grow thanks to their 20% return on net tangible equity, at a PE ratio of 10, you will do much better than by owning business with similar growth at a PE ratio of 20. Such simple things make the difference when it comes to long-term investing returns. Therefore, BRK is still a better investment than the S&P 500 (SPY).
Berkshire Hathaway’s intrinsic value
We have already estimated BRK’s earnings, $31 billion per year with an estimated growth rate between 7% and 11%. We now have to see what is the present value of those earnings. I’ll use the conservative 7% earnings growth rate but I think Buffett and company might do better in the future. We will leave the higher possible growth rate as a positive bonus.
I’ll add the $100 billion in cash to the present value calculation we derive, as it is likely the money will be deployed at some point in time at a healthy rate of return, most probably above 7%.
The thing that complicates BRK’s calculation of intrinsic value, is that the cash is not distributed and will probably not be distributed, ever. Therefore, the only cash distribution we can use for our intrinsic value calculation is the cash we can get at the point in time when we decide to sell BRK. Therefore, to get to BRK’s intrinsic value, not only do you need to have your own discount rate, but also a date in time when you wish to get your cash back, on top of a likely future valuation for BRK’s stock.
For the calculation on the future value based on the above estimation of earnings, we can use Buffett’s statement that, over the long-term, stock prices will reflect business performance. For the future stock price, all we need is a PE ratio, that is again something I will leave to up to you.
The following are BRK’s expected earnings in 2019, 2020, 2030, 2040 and 2050, in billions of USD. (based on current adjusted earnings and a growth rate of 7%).

Our potential cash return depends on the stock price and thus on the valuation on those earnings. As discussed above, the current real valuation on those earnings is 11. I find that a good assumption for future prices too. Using such an estimate, BRK’s market capitalization in 2030 should be $717 billion, $1.4 trillion in 2040 and $2.7 trillion in 2050.

Now, to get to the present, intrinsic value, we have to discount the future potential cash we can get by selling BRK stock at our preferred rate of return, and add the $100 billion of cash at hand.
At a 15% discount rate, which is my usual yardstick for comparing investments and my minimal expected return when investing, BRK doesn’t look good over the long term.

This is logical as to achieve high returns over the long-term, your return on capital invested has to be high too, or the initial purchase price has to be very low. We have estimated a growth rate of 7% for BRK, and that should be also the expected return over the long-term at current valuations.
If I use a 7% discount rate, then BRK’s is close to fairly valued from a business perspective.

However, if I add the usual equity premium of 2% to the current 10-year Treasury yield of 1.59%, and use that as a discount rate. BRK is strongly undervalued.

From an owner’s perspective, if someone can borrow at 3.59% for 30 years and use the money to buy BRK, it is such a bargain that it is unbelievable.
The low discount rate is also the reason why Buffett has been doing some buybacks. Given his long-term horizon, BRK shareholders are actually getting a bargain as the intrinsic value of BRK with a 2030 horizon is $570 billion on an expected return of 3.59%.
Berkshire – investment thesis
At the end it all boils down to the price paid and return on invested capital achieved. Buffett always hopes to achieve a return on capital that is better than the average American industry, and Berkshire will likely continue to do so in the future, even after Warren.
Therefore, the invested returns to expect from Berkshire, will be strongly related to the return on invested capital achieved. If it is above 7%, the return on your BRK investment will be higher. That’s it, when it comes to contemplating BRK’s intrinsic value. If you can borrow money at a low interest rate, for a very long time, you should consider BRK as an extreme bargain. Also, given BRK’s triple A rating, from a business owner perspective, BRK is strongly undervalued.
From a personal perspective, if you expect a 7% return, BRK is fairly valued. It is actually much better than what the S&P 500 offers with a PE ratio of 21 and probable 4% long-term earnings growth (2% historical earnings growth rate + 2% inflation). A PE ratio of 11 and 7% long-term earnings growth will strongly outperform the S&P 500 over the long-term.
Therefore, if you are looking for safety, a good return of around 7%, a large cash balance in relation to the market cap, I strongly suggest you take a look at BRK, especially if your target retirement date is beyond 2040 or 2050, BRK will outperform again because it is built in to outperform over cycles.
You can download the excel table to make your own calculations below: